
What is T-SNE?
Overview
High-dimensional single-cell technologies, such as multicolor flow cytometry, mass cytometry, and image cytometry, can measure dozens of parameters at the single-cell level. FCS Express integrates t-Distributed Stochastic Neighbor Embedding, otherwise known as t-SNE, which is a tool that allows you to map high-dimensional cytometry data onto a two dimension plot while conserving the original high-dimensional structure to help you visualize and analyze high-dimensional data.

Using t-SNE Transformations in FCS Express
The final result of the algorithm in FCS Express is a 2D plot in which the positions of cells reflect their proximity in their original high-dimensional space. Plots can further be colored with density or heat mapping of each parameter, allowing for easy visualization of populations.
Given that t-SNE is an highly demanding algorithm, the De Novo Software 's team made a great effort to improve its speed within FCS Express.
To give you an idea of how t-SNE is performing within FCS Express, we have run some speed tests to show how the two methods that are used to calculate t-SNE compare with each other in version 6.

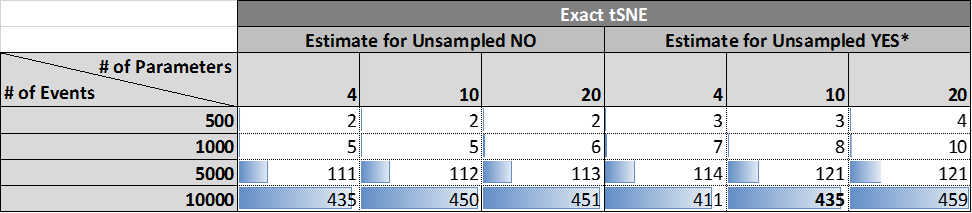
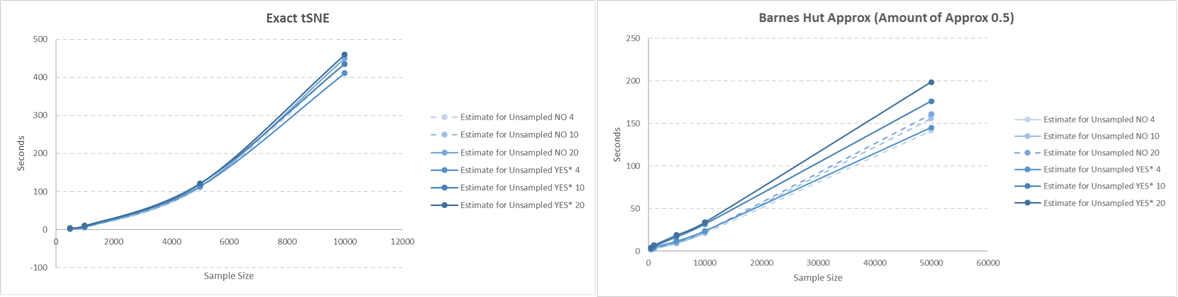
The table below shows the elapsed time (in seconds) for t-SNE calculation using the Barnes-Hut Approximation (Amount of Approximation = 0.5)with a different combination of number of considered events and number of considered parameters. In these tests, t-SNE was not estimated for unsampled events. Please refer to the Defining a t-SNE Transformation section in the software reference manual for more information about the methods and options that are available in FCS Express.
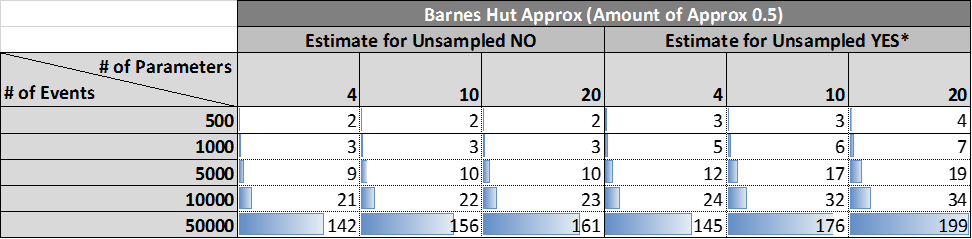
We then repeated the previous tests by enabling the Estimate t-SNE for Unsampled Events option. By enabling this option, the events that did not participate in the t-SNE calculation will be mapped to the nearest point that did participate in the t-SNE mapping. With the file used for this test, the estimation had been performed on almost half a million of events. The result of these tests can be seen in the table and scatter plots below.
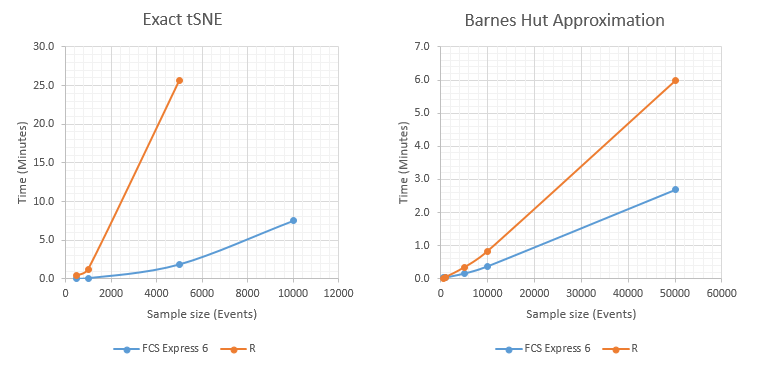
The chart below shows how t-SNE in FCS Express compares to tSNE as performed in R:
- t-SNE stands for T-Distributed Stochastic Neighbor Embedding.
- t-SNE is a nonlinear data reduction algorithm that takes multidimensional data and represents the original data in two dimensions, while preserving the original spacing of the data sets in the original high-dimensional space.
- For a better understanding and more effective use of t-SNE, please click here for an excellent overview.
- t-SNE is a nonlinear method.
- It differs from other methods in that it is focused on unrolling the native data into a three dimensional space and emphasizing the clusters found within the native high-dimensional data set.
- Exact t-SNE calculates the pair-wise distance between every pair of data points.
- The Barnes-Hut Approximation calculates an approximation of the Exact t-SNE method in that the Barnes-Hut method approximates the distributions. The Barnes-Hut method calculates the distance between each data point and its closest neighboring points only.
- If the Amount of Approximation is set to 0, the Barnes-Hut method is virtually identical to the Exact t-SNE method.
- Because the data can be randomly initialized, the data set can produce different results with each analysis.
- However, FCS Express introduced a method by which the user can specify a Seed Value.
- The Seed Value is a numerical constant that is used to standardize the initialization.
- This is the amount of approximation that is performed with the Barnes-Hut method.
- This value can range from 0 to 1.0, where 0 is No Approximation, and 1 is the maximum amount of approximation. If the amount of approximation is set to 0, the Barnes-Hut method will be virtually identical to the Exact t-SNE method.
- In FCS Express, the default Amount of Approximation is 0.5.
- Perplexity is a measure for information. In t-SNE, the perplexity is used to sets the number of nearest neighbors considered.
- In t-SNE, typical values for the perplexity range between 5 and 50.
- By default, FCS Express uses a sample size of 3000. However, a user can specify any number for the subset of cells to be included in the transformation.
- However, the larger the sample size, the more time it will take to calculate the transformation.
- The maximum number for the sample size will be the total number of cells within the specified gate of the transformation.
- t-SNE is a resource-intensive algorithm because it inspects every single data point and measures the distances between every pair of points.
- The Barnes-Hut method measures the distance between every point and a subset of points.
- Currently, the result of a t-SNE transformation is not saved within the layout or with the .FCS file itself and instead is calculated automatically or manually on demand when opening a layout.
- If your t-SNE transformation is computation intensive we suggest to export the tSNE X and tSNE Y parameters with your original data file as a new FCS file. The resulting file can then be accessed and examined quickly and easily without recalculating the transformation. The new tSNE X and tSNE Y parameters may be easily exported via the Export Data dialog. We also recommend to saving the original layout in which the transformation was created so you can easily review the settings used in the transformation at any time.
- Github by Laurens van der Maaten, co-author of original implementation.
- Distill article discussing the effective use of t-SNE
Learn more about tSNE in FCS Express via a recorded webinar.
-
Installation
-
Licenses
-
- Can I get more information regarding the Add-Ons that can be purchased with a license?
- Can I lock my template based on an electronic signature?
- Does FCS Express have any features to help meet 21 CFR Part 11 compliance?
- Does FCS Express have Quality Control features?
- Does FCS Express offer Single Sign On capability?
- How do I configure SQL Server to host a database for FCS Express?
- What database options are available when I purchase the Security option?
- What is the difference between the different types of Users that are available with a Security and Logging license?
- What is the difference between the Logging option and System Level Audit Trails?
- What SQL Server permissions are needed?
-
-
- Can I share my USB dongle or countercode license with another user?
- Can I track usage of the internet dongle?
- Can I try out the Internet Dongle before I make a purchase?
- Can the administrator log users out?
- Do you have to be connected to the internet at all times with the Internet dongle?
- How can users be added to an internet dongle license?
- How do I activate my dongle?
- How do I change my internet dongle/site license password?
- How many people can be logged in at the same time?
- How many user accounts can I create?
- If a user left the computer running can the user log themselves out from another computer?
- What are the differences between the internet dongle and network licensing options?
- What happens if I lose my internet connection?
- What happens if the user leaves the computer without logging out?
- What happens to the users login in case of an unexpected interruption? For instance, a software crash, power failure, etc.
- Why am I receiving a message that FCS Express cannot connect to De Novo Software servers?
- Show all articles ( 1 ) Collapse Articles
-
-
- Can I convert my Cytek license from the countercode licensing option to another licensing option?
- How can I claim my license purchased through BD Accuri Cytometers?
- How can I claim my license purchased through BD Biosciences?
- How can I claim my license purchased through Nexcelom Biosciences?
- How can I claim my license purchased through Sysmex-Partec GmbH?
- How can I claim the FCS Express license that came with my Cytek instrument purchase?
-
-
Layouts & Loading Data
-
- Can I customize my Quick Access Toolbar?
- For an existing layout, can I change the way FCS Express remembers parameters?
- How can I exclude histogram overlays from batch processing?
- How do I change my layout from portrait to landscape?
- How do I change the resolution of my exported images?
- How do I re-establish data files that were linked to a layout?
-
- Are Beckman Coulter LMD files unique?
- Can I find a support resource page for the analysis of Cytek data in FCS Express?
- How can I easily create the "filename" column in the "ExtraKeywords Table.csv" file?
- How can I load a Sony MA900 Index Sort file into FCS Express?
- How can I load data from the BD Accuri C6 Flow Cytometer?
- How can I load MACSQuantify files that were exported from MACSQuantify software version 3.0.1?
- How can I quickly reload all of the data files in the data list?
- How do I change the display in my plots from one data file to another data file?
- How do I export .ICE files from Thermo Cellomics HCS Studio?
- How do I tell FCS Express what plate size to use if that information is not included in the data file?
- How do I upload files to the De Novo Software FTP site?
- How do I use BD Accuri CFlow files with Multicycle DNA analysis in FCS Express?
- How do I work with images from the Thermo Scientific Attune CytPix?
- What is the Elapsed Time setting in the Gallios software and how do I convert it to real time?
- Why am I seeing a warning message when loading my Cytek data onto a layout object?
- Why are iterations in my Data List gray?
- Why are there sometimes access violations when I save and load files?
- Why do I get the message that a data file exported from a FACSDiva™ Experiment is invalid?
- Show all articles ( 3 ) Collapse Articles
-
- How are existing quadrants handled when an old layout is opened in version 7.20 and later?
- How can I set quadrants to behave like conventional gates?
- How can I set quadrants to behave like in earlier versions?
- How can quadrants be linked?
- Quadrants in FCS Express versions 7.20 / 7.24 and later
- Why does the Quadrants Options window appear when I open an older layout in version 7.24 or later?
- Why have percentages reported by quadrants changed after updating to FCS Express version 7.20 or later?
-
-
Data Analysis
-
- Caveats when using Biexponential Scaling with automatic Below Zero parameter detection in the presence of outliers.
- How can I create a merged data with equally-sized downsampled samples?
- How can I do pre-processing for high-dimensional data analysis?
- How can I explore tSNE/UMAP plots?
- How do I use SPADE?
- What is FlowSOM?
- What is T-SNE?
- What is UMAP?
-
- Can FCS Express integrate Python scripts?
- Can I use the FlowAI script in FCS Express?
- Can I use the FlowClean R Script with FCS Express?
- How can I create a matrix of autofluorescence, and import autofluorescence into EasyPanel?
- How can I recreate ratiometric data acquired in FACSDiva?
- How do I use R Integration with FCS Express?
- How does FCS Express implement software compensation?
- If my data does not have a Time parameter, can I create one?
- What is compensation?
- What is the compensation workflow in FCS Express?
- When acquiring spectral data, should my single-stained controls be "as bright or brighter" than my fully-stained sample?
-
- Can a set of quadrants be both percentile and floating?
- Can I customize the display of my data from different instruments?
- Can I disable the live updating feature?
- How can I display all of my detectors for my Cytek data?
- How can I set FCS Express so my FCS 3.0 biexponential data looks the same as it did in the BD FACSDiva software?
- How do I display Summit data in FCS Express as it appears in the Summit Software?
- How do I fix the biexponential axes on a plot?
- How do I rescale CytoFLEX and DxFLEX data so it displays as it did at acquisition?
- How do I update my density and contour plots created in Version 4 to use the newest color palette?
- What are resolution options?
- What is Biexponential and Hyperlog Scaling?
- What is the best way to set FCS Express to display FCS 3.0 data from FACSDiva on a 4 decade log scale?
- Where can I get more information regarding DNA analysis using the Multicycle AV?
- Why can’t I change my plot axis labels from the Name keyword to the Stain keyword?
- Why do I see a warning message when inserting a Spectrum Plot?
- Why do my dot plots appear sparse and blocky?
- Why is the text on the right most label cut off my plot?
- Show all articles ( 2 ) Collapse Articles
-
- Can I create an output file that contains the same plot from each data file on a single page?
- Can I export spectral data to the FCS format?
- How can I successfully export a GatingML file?
- How do the batch processing run modes differ, and why would I use them?
- Why do I get an “Old format or invalid type library” error when using Microsoft excel during batch analysis?
-
- How are statistics in FCS Express calculated compared to how they are calculated in BD FACSDiva?
- How can I display my statistical data in Scientific Notation?
- How do I calculate EC/IC Anything?
- What is “Stain Index” and how do I calculate it with FCS Express?
- What is MFI (Mean or Median Fluorescence Intensity) and how do I calculate it in FCS Express?
- Why have percentages reported by quadrants changed after updating to FCS Express version 7.20 or later?
- Why is the Geometric Mean being reported as NaN or ##ERROR##?
-
-
Image Cytometry
-
- How do I adjust the axes to display small particle data from Amnis CellStream?
- How do I choose which images and parameters to view in a Data Grid?
- How do I export/save data from IDEAS software and load it in FCS Express?
- How do I make my images in the data grid larger?
- How do I pseudo-color images in a data grid?
- How do I work with Amnis derived image cytometry data in FCS Express?
-
- Can I display heat maps with my Image Cytometry data?
- Can I work with data from PerkinElmer Instruments?
- Do you offer 21 CFR Part 11 compliance options for the Image Cytometry Version?
- Do you offer image segmentation or image analysis?
- How can Attune™ CytPix data sets with images (.ACS files) be merged for high dimensional analysis?
- How do I use CellProfiler Data with FCS Express?
- How do I use ImageJ with FCS Express?
- What file formats are compatible with FCS Express Image Cytometry?
- Where can I find Nexcelom Resources and Applications?
-
-
FCS Express on Mac
-
Upgrading FCS Express
-
- Can different versions of FCS Express exist on the same computer?
- How can I view and convert my V3 layouts to FCS Express 7?
- How do I import my version 3 security databases into newer versions of FCS Express?
- How do I update Density Plots created in Version 4?
- Is there an upgrade discount from earlier versions of FCS Express?
- Version 4 Internet Dongle Retirement
- Why are my density plots from V3 not displayed correctly in later versions?
- Why are there fewer outlier dots on my FCS Express 5 and later density plots than in V4?
-
Clinical & Validation Ready
-
- Can I get more information regarding the Add-Ons that can be purchased with a license?
- Can I lock my template based on an electronic signature?
- Does FCS Express have any features to help meet 21 CFR Part 11 compliance?
- What is the difference between the different types of Users that are available with a Security and Logging license?
- What is the difference between the Logging option and System Level Audit Trails?