 Explore the Scientific R&D Software













Resources for working with FACSDiscover S8 and A8 data in FCS Express
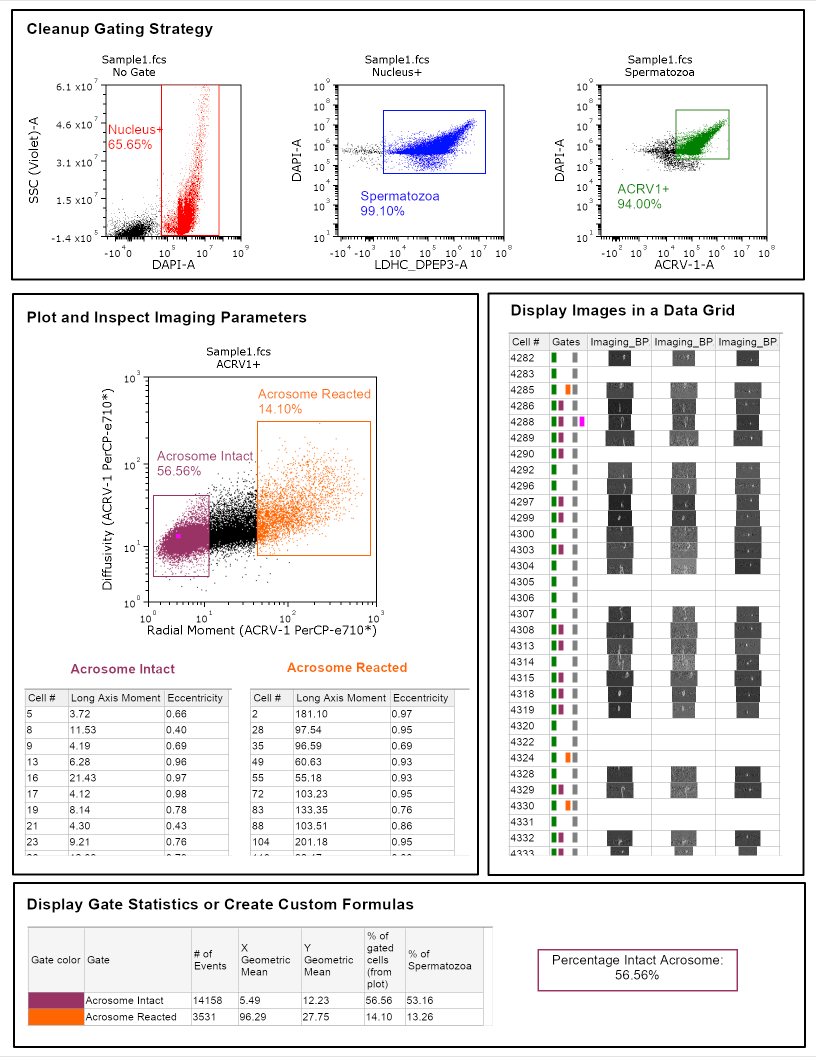
The BD FACSDiscover™ S8 and A8 combine full spectrum flow cytometry with BD CellView™ Image Technology, capturing a reconstructed image alongside spectral fluorescence data in real time. The example layout below highlights how FCS Express's Image Cytometry features come together to make sense of that combined data set- including image display.
FACSDiscover A8 Data Layout
In this example layout:
- Image-derived parameters such as Diffusivity and Radial Moment are plotted directly alongside standard fluorescence parameters to characterize the spatial distribution of the acrosomal marker ACRV-1, distinguishing a tightly confined signal from a more diffuse one, and indicating intact vs reacted acrosomes.
- Gate statistics track population percentages and allow for the calculation of a custom statistic "% Intact Acrosome" built directly from imaging-derived gates.
- Throughout, Data Grids let users pull up and review individual event images side-by-side with other recorded features.
- Spectrum plots are displayed to compare the spectral signatures of individual populations.
How to Load A8/S8 Spectral and Imaging Data
FCS Express is now compatible with spectral and imaging data acquired on the BD FACSDiscover A8/S8 instruments. As of version 7.32 or later, FCS Express can load A8/S8 images, display the raw spectral data in spectrum plots, and perform spectral unmixing.
Note A8/S8 images must be converted to the .tiff file format to load in FCS Express.
Please refer to the topics below for working with A8/S8 data in FCS Express.
New Instrument Specific Settings have been added with version 7.32.0060 for the BD FACSDiscover A8 and S8 instruments. By default, these settings enable the loading of images, and the automatic creation of a spectral parameter (needed for spectrum plots, and spectral unmixing in FCS Express).

To view the new Instrument Specific Settings, navigate to the Ribbon and select File > Options to open the FCS Express User Options window. Then select Data Loading > FCS File Options > Instrument Specific Settings.
If you do not see the four Instrument Specific Settings for the A8 and S8 as depicted above, or you are unable to load images, a spectrum plot, or perform spectral unmixing in FCS Express with A8/S8 data:
- Click on the Restore Default Settings button.

This will reset all Instrument Specific Settings to their default values and add the four Instrument Specific Settings for A8 and S8 instruments.
Note the only difference between the four Instrument Specific Settings are:
- The instrument the settings apply to, A8 or S8.
- The export option selected when exporting data from BD FACSChorus.
How to Turn Off Loading Image Data
The Instrument Specific Settings for the A8/S8 include a new section, Image Options, to enable FCS Express to find and automatically load images associated with A8/S8 fcs files loaded into the layout.

This option is enabled by default. If you would like FCS Express to not load images into the Layout by default, for example if you encounter slower loading or reduced performance when analyzing data with images, uncheck the Load Images box.
How can I apply the updated Instrument Specific Settings to the data files in my layout?
BD A8/S8 Spectral Options
To support the loading of A8/S8 spectral data into spectrum plots and spectral unmixing in FCS Express, new BD A8/S8 Specific Options have been added to the Instrument Specific Settings.

To enable spectral unmixing and loading of A8/S8 data into spectrum plots, the option to Import full spectrum as individual parameter must be checked. Other BD A8/S8 Specific Options include:
- Import the spectra of individual lasers as individual parameters – this allows viewing of detectors from specific laser lines on a spectrum plot (i.e. plot only YG detectors or UV detectors).
- Hide individual detector parameters from raw data – hides the raw spectral parameters (detectors) from your data on loading.
See related FAQs below for applying updated Instrument Specific Settings to your layout and the difference between Recommended, All and Small export options for the BD FACSDiscover A8/S8.
For optimal loading of A8/S8 data, ensure all Instrument Specific Settings for the A8/S8 are present in your user options.
To load A8/S8 spectral data with images, note the following requirements:
1. FCS Express is not compatible with the .cvw file format used by BD FACSDiscover instruments to store images. To load A8/S8 image data, the .cvw file must be converted into .tiff image files using the BD CellView Image Extractor available within the BD FACSChorus software.
2. See this FAQ for details about the FCS File format to export from FACSChorus.
3. The folder containing the extracted images must be placed in the same folder as the fcs file (see Matching FCS Data to Images).
For FCS Express to properly link images to events, the fcs file and associated image data must be in the same folder.
In the example below, a single fcs file and the image folder containing extracted .tiff images are present in the same folder, “Folder A”.

FCS Express will match an fcs file to the correct images by using the name of the image folder. The image folder itself must start with the fcs filename without the extension (“sample1”), followed by a “_images_*” suffix where “*” can be anything.
The image folder structure will contain numeric subfolder(s) which contain .tiff images. It is critical to keep the image folder structures intact. Do not alter or rename the individual TIFF files or move them from their generated subfolders.
FCS Express allows you to view the data acquired for every event in A8/S8 data sets, including images, using the Data Grid.
To view images in the Data Grid:
- From the Ribbon, select Insert > General > Data Grid to insert a Data Grid on the layout.

The Data Grid displays each parameter or image channel as a column that can be shown or hidden. Each row represents an event. Like all objects in FCS Express, multiple Data Grids can be present on the layout from the same or different data files to compare results.

The Data Grid has unique formatting properties. To format a Data Grid:
- Select the Data Grid, then navigate to the Format tab on the ribbon or…
- Right-click on the Data Grid, select Format from the pop-up menu, then choose a category from the dropdown to open in the formatting window.
The following formatting options are particularly useful when displaying images in the Data Grid:
a) Parameters To Display – show all or hide specific parameters or image channels. A8/S8 images will be the last parameters listed, allowing for quick selection of only images in the Data Grid.

b) Data Image Options – change the background color of the image columns and other columns to improve visualization of images.

c) Gates to Display – add a new Gates column to show backgating for each event. Gates will be displayed as colored bars in the Gates column.

d) General – assign unique names to each Data Grid on the layout using the Data window name.
Why are my BD FACSDiscover images not colored? Can I assign colors to my images in FCS Express?
How to Apply Gates to the Data Grid
To apply a gate to the Data Grid:
- Drag and drop the desired gate from any plot onto the Data Grid.
- Select the Data Grid, then from the ribbon click on the Gating > Current Gate dropdown and select the desired gate.
How to Enlarge Images from the Data Grid
The size of images displayed in the Data Grid can be changed in two ways – within the Data Grid and as a separate image outside of the Data Grid. To change the size of the images displayed in a column of the Data Grid:
- Select the column header
- Click on the bottom border
- Drag down to adjust column height

Alternatively, all columns can be expanded at once by these steps:
1. Select a row by clicking in the gray column on the far-left side of the data list.
2. In that gray column on the far-left side of the data list, hover over the bottom border of the selected row.
3. Click and drag the border down to expand the row heights.

Individual images within the Data Grid can also be embedded on the layout and enlarged:
- Left-click and hold to select the image in the Data Grid.
- Drag the image to an empty space in the layout.
- Release the mouse button.
The image from the data grid will now be inserted as a new picture object on the layout. By default, the picture will appear larger than the image in the Data Grid. The picture can be further resized by selecting the picture and dragging one of the vertices on the pictures border.
FAQs with Tips
Instrument Specific Settings are only applied when you first load the data file into your layout. Any changes made after data loading to the Instrument Specific Settings will require you to reload the data to apply the changes.
To apply changes you’ve made to the Instrument Specific Settings, navigate to the Ribbon and select Data > Save/Load Data > Reload.
The BD FACSDiscover A8/S8 provides three options for exporting fcs files - All, Recommended and Small.
When an FCS file is loaded, FCS Express will automatically detect whether the Instrument was A8 or S8 and apply the appropriate Instrument Specific Settings, depending on the type of export (All, Recommended or Small).
Importantly, the Recommended and All export options contain unmixed and raw spectral data. FCS files exported with the Small export only contain unmixed spectral data and therefore cannot be used with spectrum plots or to perform spectral unmixing as these tasks require raw spectral data.
Please consult with the BD FACSChorus software manual for further details on the parameter types (i.e. -A, -H, -W, -TTP) included in each of the fcs file export options above.
FCS Express is not compatible with the .cvw file format used by BD FACSDiscover instruments to store images.
To load A8/S8 image data, the .cvw file must be converted into .tiff image files using the BD CellView Image Extractor available within the BD FACSChorus software.
FCS Express displays TIFF images in greyscale. Currently, individual images cannot be colored. However, this feature is scheduled for inclusion in a future release of FCS Express.
Currently, individual images cannot be overlaid in FCS Express.
Cosmetic image adjustments performed on A8/S8 instruments, such as changes to gamma, min/max intensity, and smoothing are currently not applied to the TIFF images in FCS Express.
Yes, the Data Grid displays each parameter or image channel as a column that can be shown or hidden via the formatting options for Parameters to Display.
To show or hide specific parameters or image channels, use the options “Only the items checked below” or “All items except those checked below”. A8/S8 images will be the last parameters listed in the dropdown, allowing for quick selection of only images in the Data Grid.
See How To View Images With The Data Grid for details on how to make images larger in the Data Grid.
It is expected to take a few minutes to load all unmixing controls into the unmixing wizard. For example, our team reported that loading 150 MB of data took about 2 minutes.
tags: images, image cytometry, FACSDiscover A8, FACSDiscover S8
-
Installation
-
Licenses
-
- Can I get more information regarding the Add-Ons that can be purchased with a license?
- Can I lock my template based on an electronic signature?
- Does FCS Express have any features to help meet 21 CFR Part 11 compliance?
- Does FCS Express have Quality Control features?
- Does FCS Express offer Single Sign On capability?
- How do I configure SQL Server to host a database for FCS Express?
- What database options are available when I purchase the Security option?
- What is the difference between the different types of Users that are available with a Security and Logging license?
- What is the difference between the Logging option and System Level Audit Trails?
- What SQL Server permissions are needed?
-
-
- Can I share my USB dongle or countercode license with another user?
- Can I track usage of the internet dongle?
- Can I try out the Internet Dongle before I make a purchase?
- Can the administrator log users out?
- Do you have to be connected to the internet at all times with the Internet dongle?
- How can users be added to an internet dongle license?
- How do I activate my dongle?
- How do I change my internet dongle/site license password?
- How many people can be logged in at the same time?
- How many user accounts can I create?
- If a user left the computer running can the user log themselves out from another computer?
- What are the differences between the internet dongle and network licensing options?
- What happens if I lose my internet connection?
- What happens if the user leaves the computer without logging out?
- What happens to the users login in case of an unexpected interruption? For instance, a software crash, power failure, etc.
- Why am I receiving a message that FCS Express cannot connect to De Novo Software servers?
- Show all articles ( 1 ) Collapse Articles
-
-
- Can I convert my Cytek license from the countercode licensing option to another licensing option?
- How can I claim my license purchased through BD Accuri Cytometers?
- How can I claim my license purchased through BD Biosciences?
- How can I claim my license purchased through Nexcelom Biosciences?
- How can I claim my license purchased through Sysmex-Partec GmbH?
- How can I claim the FCS Express license that came with my Cytek instrument purchase?
-
-
Layouts & Loading Data
-
- Can I customize my Quick Access Toolbar?
- For an existing layout, can I change the way FCS Express remembers parameters?
- How can I exclude histogram overlays from batch processing?
- How do I change my layout from portrait to landscape?
- How do I change the resolution of my exported images?
- How do I re-establish data files that were linked to a layout?
-
- Are Beckman Coulter LMD files unique?
- Can I find a support resource page for the analysis of Cytek data in FCS Express?
- How can I easily create the "filename" column in the "ExtraKeywords Table.csv" file?
- How can I load a Sony MA900 Index Sort file into FCS Express?
- How can I load data from the BD Accuri C6 Flow Cytometer?
- How can I load MACSQuantify files that were exported from MACSQuantify software version 3.0.1?
- How can I quickly reload all of the data files in the data list?
- How do I change the display in my plots from one data file to another data file?
- How do I export .ICE files from Thermo Cellomics HCS Studio?
- How do I tell FCS Express what plate size to use if that information is not included in the data file?
- How do I upload files to the De Novo Software FTP site?
- How do I use BD Accuri CFlow files with Multicycle DNA analysis in FCS Express?
- How do I work with images from the Thermo Scientific Attune CytPix?
- Resources for working with FACSDiscover S8 and A8 data in FCS Express
- What is the Elapsed Time setting in the Gallios software and how do I convert it to real time?
- Why am I seeing a warning message when loading my Cytek data onto a layout object?
- Why are iterations in my Data List gray?
- Why are there sometimes access violations when I save and load files?
- Why do I get the message that a data file exported from a FACSDiva™ Experiment is invalid?
- Show all articles ( 4 ) Collapse Articles
-
- How are existing quadrants handled when an old layout is opened in version 7.20 and later?
- How can I set quadrants to behave like conventional gates?
- How can I set quadrants to behave like in earlier versions?
- How can quadrants be linked?
- Quadrants in FCS Express versions 7.20 / 7.24 and later
- Why does the Quadrants Options window appear when I open an older layout in version 7.24 or later?
- Why have percentages reported by quadrants changed after updating to FCS Express version 7.20 or later?
-
-
Data Analysis
-
- Caveats when using Biexponential Scaling with automatic Below Zero parameter detection in the presence of outliers.
- How can I create a merged data with equally-sized downsampled samples?
- How can I do pre-processing for high-dimensional data analysis?
- How can I explore tSNE/UMAP plots?
- How can I unmerge my data files and run batch processing?
- How do I use SPADE?
- What is FlowSOM?
- What is T-SNE?
- What is UMAP?
-
- Can FCS Express integrate Python scripts?
- Can I use the FlowAI script in FCS Express?
- Can I use the FlowClean R Script with FCS Express?
- How can I create a matrix of autofluorescence, and import autofluorescence into EasyPanel?
- How can I recreate ratiometric data acquired in FACSDiva?
- How do I use R Integration with FCS Express?
- How does FCS Express implement software compensation?
- If my data does not have a Time parameter, can I create one?
- What is compensation?
- What is the compensation workflow in FCS Express?
- When acquiring spectral data, should my single-stained controls be "as bright or brighter" than my fully-stained sample?
-
- Can a set of quadrants be both percentile and floating?
- Can I customize the display of my data from different instruments?
- Can I disable the live updating feature?
- How can I display all of my detectors for my Cytek data?
- How can I set FCS Express so my FCS 3.0 biexponential data looks the same as it did in the BD FACSDiva software?
- How do I display Summit data in FCS Express as it appears in the Summit Software?
- How do I fix the biexponential axes on a plot?
- How do I rescale CytoFLEX and DxFLEX data so it displays as it did at acquisition?
- How do I update my density and contour plots created in Version 4 to use the newest color palette?
- What are resolution options?
- What is Biexponential and Hyperlog Scaling?
- What is the best way to set FCS Express to display FCS 3.0 data from FACSDiva on a 4 decade log scale?
- Where can I get more information regarding DNA analysis using the Multicycle AV?
- Why can’t I change my plot axis labels from the Name keyword to the Stain keyword?
- Why do I see a warning message when inserting a Spectrum Plot?
- Why do my dot plots appear sparse and blocky?
- Why is the text on the right most label cut off my plot?
- Show all articles ( 2 ) Collapse Articles
-
- Can I create an output file that contains the same plot from each data file on a single page?
- Can I export spectral data to the FCS format?
- How can I successfully export a GatingML file?
- How can I unmerge my data files and run batch processing?
- How do the batch processing run modes differ, and why would I use them?
- Why do I get an “Old format or invalid type library” error when using Microsoft excel during batch analysis?
-
- How are statistics in FCS Express calculated compared to how they are calculated in BD FACSDiva?
- How can I display my statistical data in Scientific Notation?
- How do I calculate EC/IC Anything?
- What is “Stain Index” and how do I calculate it with FCS Express?
- What is MFI (Mean or Median Fluorescence Intensity) and how do I calculate it in FCS Express?
- Why have percentages reported by quadrants changed after updating to FCS Express version 7.20 or later?
- Why is the Geometric Mean being reported as NaN or ##ERROR##?
-
-
Image Cytometry
-
- How do I adjust the axes to display small particle data from Amnis CellStream?
- How do I choose which images and parameters to view in a Data Grid?
- How do I export/save data from IDEAS software and load it in FCS Express?
- How do I make my images in the data grid larger?
- How do I pseudo-color images in a data grid?
- How do I work with Amnis derived image cytometry data in FCS Express?
-
- Can I display heat maps with my Image Cytometry data?
- Can I work with data from PerkinElmer Instruments?
- Do you offer 21 CFR Part 11 compliance options for the Image Cytometry Version?
- Do you offer image segmentation or image analysis?
- How can Attune™ CytPix data sets with images (.ACS files) be merged for high dimensional analysis?
- How do I use CellProfiler Data with FCS Express?
- How do I use ImageJ with FCS Express?
- Resources for working with FACSDiscover S8 and A8 data in FCS Express
- What file formats are compatible with FCS Express Image Cytometry?
- Where can I find Nexcelom Resources and Applications?
-
-
FCS Express on Mac
-
Upgrading FCS Express
-
- Can different versions of FCS Express exist on the same computer?
- How can I view and convert my V3 layouts to FCS Express 7?
- How do I import my version 3 security databases into newer versions of FCS Express?
- How do I update Density Plots created in Version 4?
- Is there an upgrade discount from earlier versions of FCS Express?
- Version 4 Internet Dongle Retirement
- Why are my density plots from V3 not displayed correctly in later versions?
- Why are there fewer outlier dots on my FCS Express 5 and later density plots than in V4?
-
Clinical & Validation Ready
-
- Can I get more information regarding the Add-Ons that can be purchased with a license?
- Can I lock my template based on an electronic signature?
- Does FCS Express have any features to help meet 21 CFR Part 11 compliance?
- What is the difference between the different types of Users that are available with a Security and Logging license?
- What is the difference between the Logging option and System Level Audit Trails?