Assays to assess the proliferative activity of cells are used frequently for monitoring the health and growth rate of cell populations. In this type of assay, a cell tracking dye, such as CFSE, is incorporated into the cells. With each round of cell division, the relative fluorescent intensity of the dye decreases by half.
As an initially homogeneous population of cells divides, you will get a mixture of cells containing a half, a quarter, an eighth, etc., of the initial population. Different conditions often cause a population of cells to change their proliferation characteristics, and understanding these effects is important in many different fields.
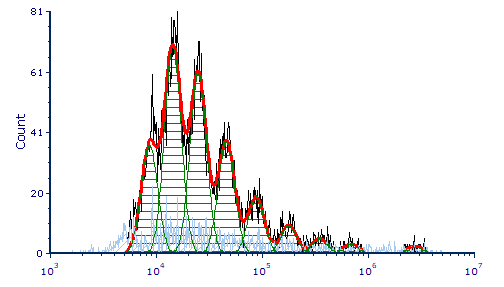
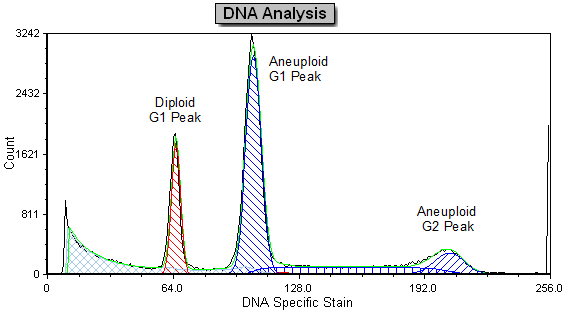
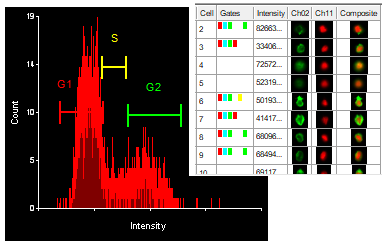
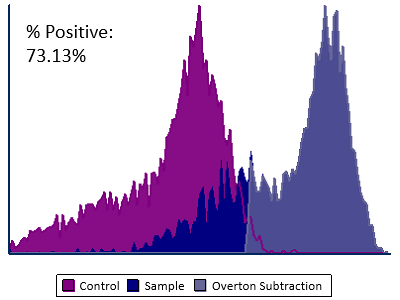
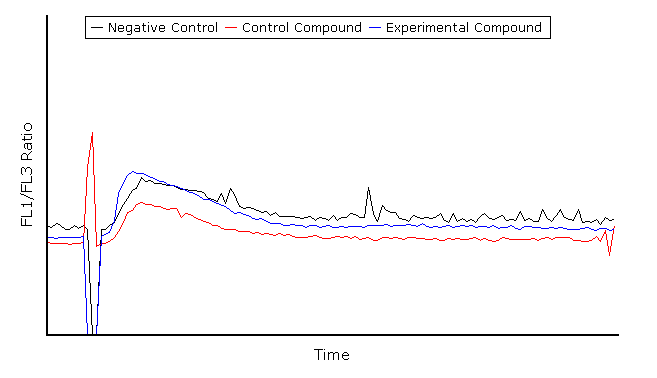
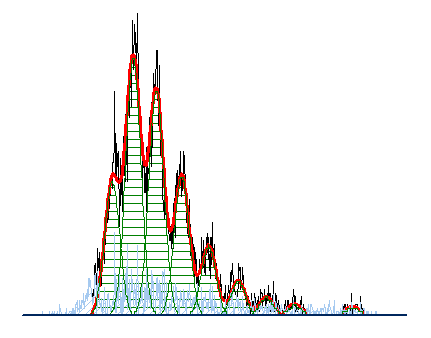
If you look at at the histogram below, you may see a distribution a similar distribution after several divisions:
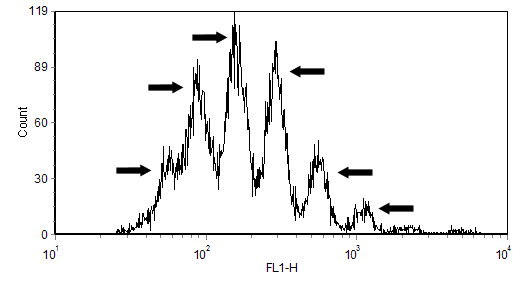
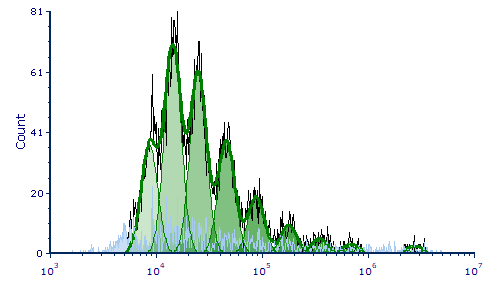
Each peak (highlighted by an arrow) in the histogram above represents a population of cells that have divided. It is very common to have the different populations overlap, as they do above. Because the standard deviation of the different populations is often greater than the separation between the populations, it is therefore impossible to simply choose a position on the plot to denote a particular generation.
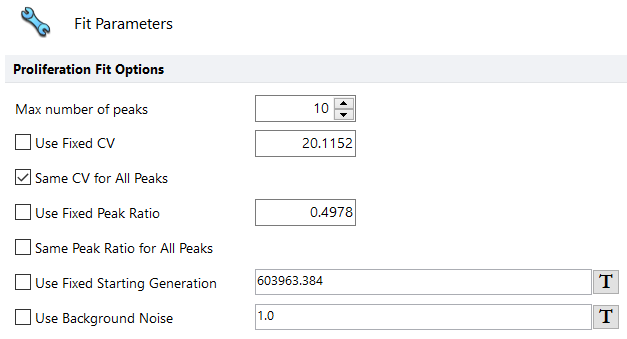
FCS Express uses a sophisticated linear least-squares fitting process to extract the correct information from your data and separate the populations.
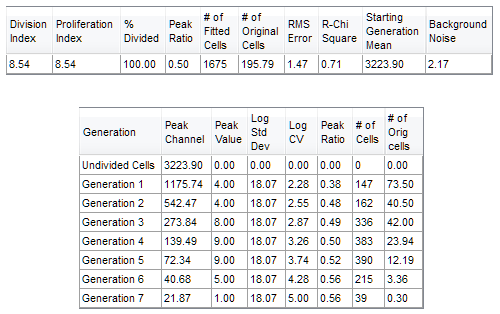
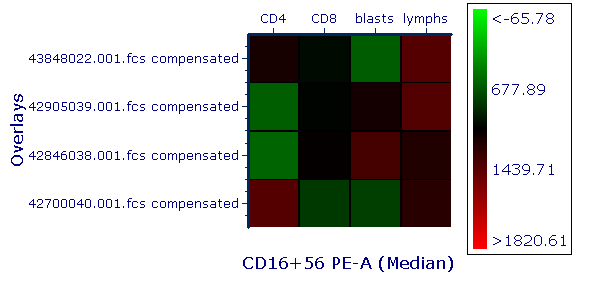
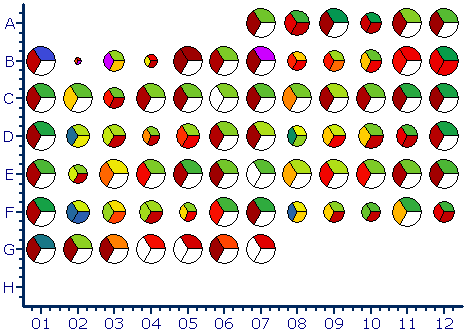
FCS Express provides a wide range of statistics about the model's results for your proliferation analysis. It is possible to display these anywhere in your layout and export in various reports, including Microsoft Excel, using tokens.