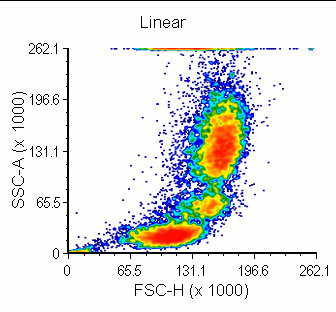
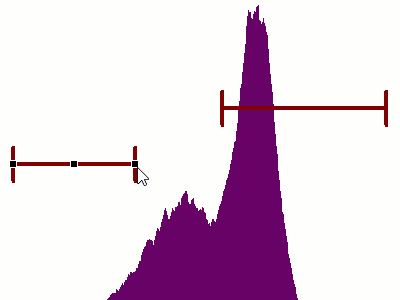
Flow data are displayed historically on either a linear or logarithmic scale, and the appropriate scaling is stored in the header of the data file. Although FCS Express has supported displaying linear data on a logarithmic scale, the data traditionally have been displayed on the same scale as it was acquired.
The logarithmic scale has the major disadvantage of not displaying values below zero. This is a severe limitation when performing software compensation and a significant proportion of the data have values below zero. When displayed on a log scale, the negative values are placed on the axis. This makes it very easy to be misled and overcompensate your data.
To overcome this limitation, several additional scalings have been developed. These scalings share the general characteristic in behaving linearly close to zero and logarithmically farther away from zero. These scalings also are defined to be able to graph data below zero. Scalings that are a combination of linear and log scalings are called hybrid scalings.
FCS Express supports several different hybrid scalings, and you quickly can switch to and customize the one(s) you prefer.
Click on the images below for more information about the axis scaling.


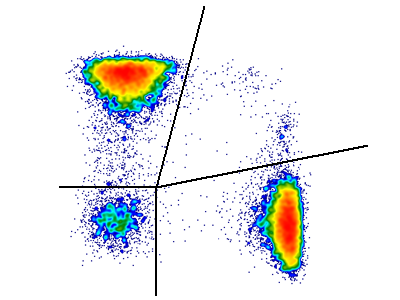
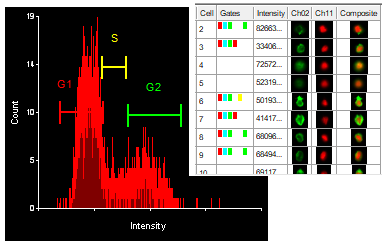
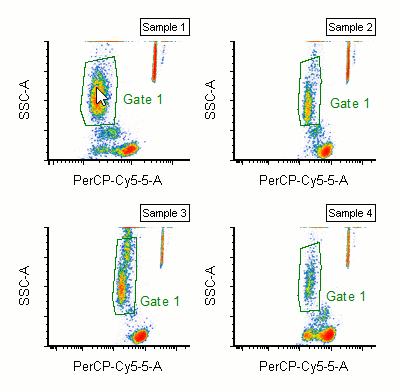
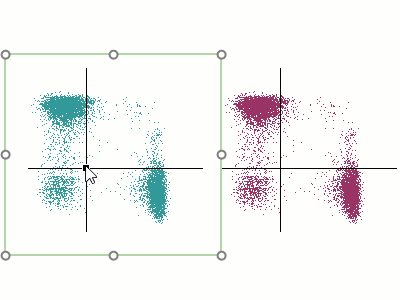
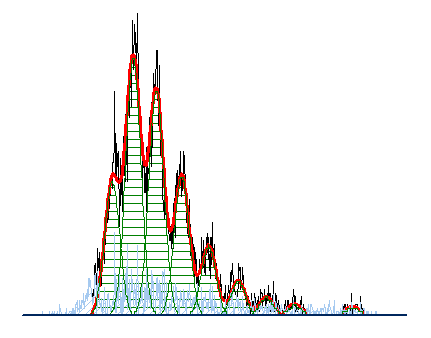
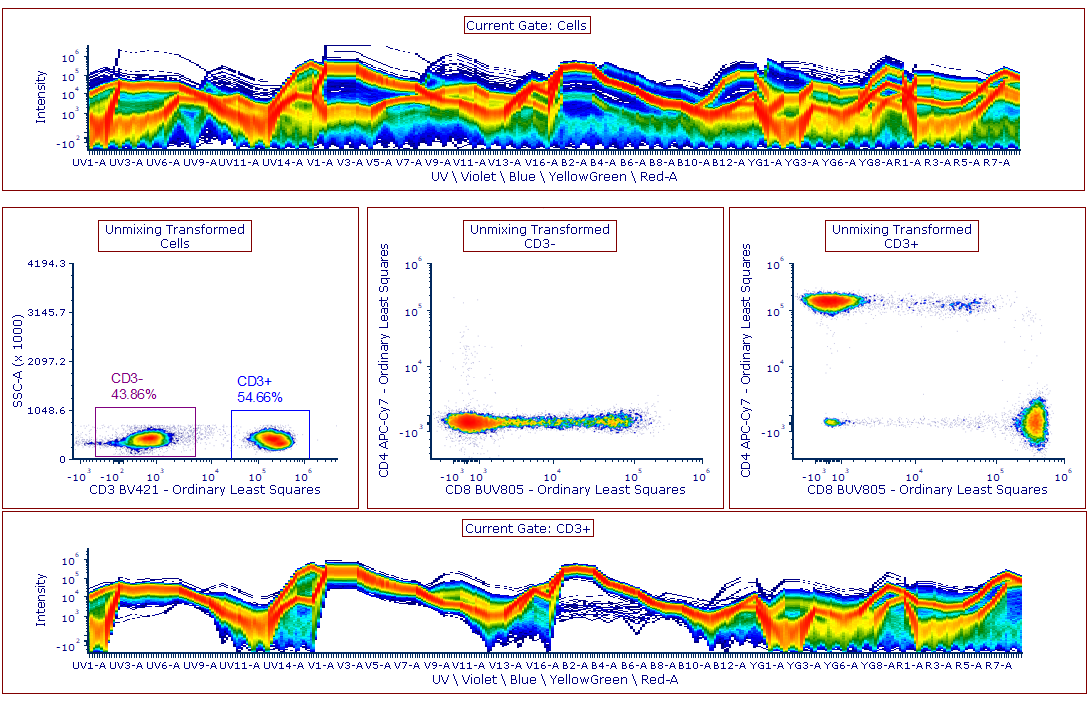
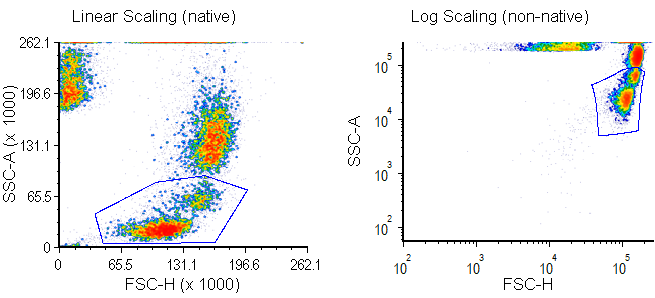
Any gates drawn in FCS Express are displayed appropriately when the scaling of either or both axes are changed. In the example below, notice how the straight lines of the polygon gate from the linear scaling become curved when displayed on a non-native scale, such as log space. This reflects the non-intuitive mapping of linear coordinates to logarithmic. The gate will retain the restrictions of the original space after scaling changes. If a gate cannot be repositioned as preferred in the newly-scaled space, redraw and replace the existing gate to adopt the new range of dimensions, which are defined by the scaling used.
Making manual adjustments to the scaling of plots displayed in FCS Express is now automatically applied to all plots using that parameter without having to many any additional modifications. Remembering the scaling formula makes adjusting parameter scaling easy. All data files, regardless of the scale that they were acquired with, can be displayed in any of the scalings supported by FCS Express.