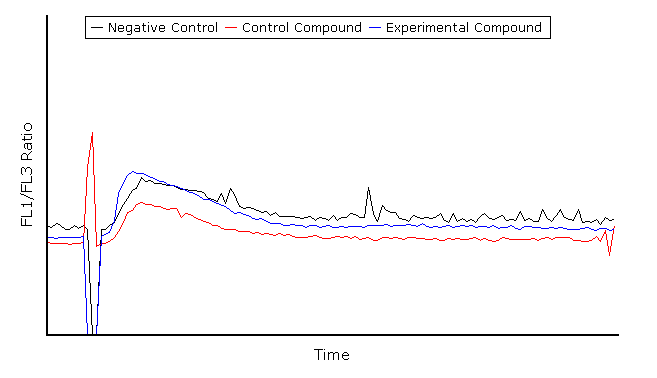
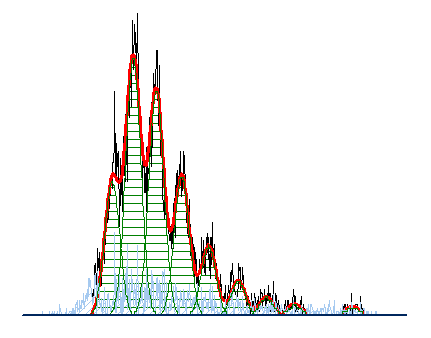
Hopefully, when you are analyzing immunofluorescence data, there is a large difference between your control and positive population, so you may distinguish them easily. When the positives and controls are close together, the process of dividing positives from negatives can become less of a science and more of an art. FCS Express helps you get back to the science.

In 1988, Roy Overton dealt with the issue of mathematically teasing apart positive and negative populations (Cytometry 9:619-626). FCS Express implements his solutions with a few clicks of the mouse. Subtraction Plots designate which file is the sample and which file is the control; FCS Express will automatically calculate the percentage positive via channel by channel subtraction or by using the Overton subtraction technique. Additionally, subtraction plots may perform an addition or division of the data sets.
In addition, you can specify a control histogram on your plot and have the percent positive statistic be calculated automatically while incrementing through samples.

Have Questions? Get Help.
Histogram Subtraction in the FCS Express Manual
Histogram Subtraction On demand video content