Spectral flow cytometry is used to sample more parameters per single cell or particle than traditional flow cytometry. In contrast to conventional flow cytometers, spectral flow analyzers and sorters substitute mirrors, optical filters, and photomultiplier tubes (PMTs) with a spectrograph and multichannel detector to use fluorescence or Raman spectroscopy.
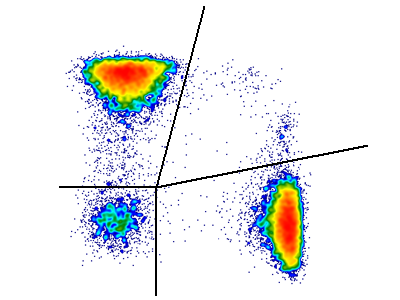
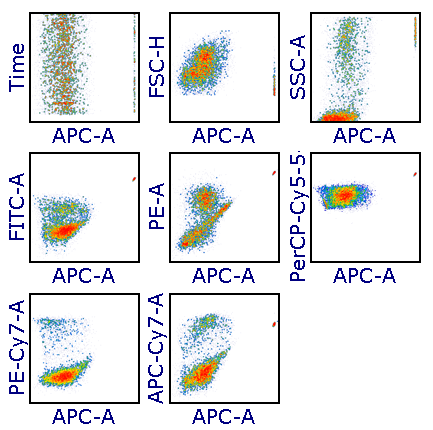
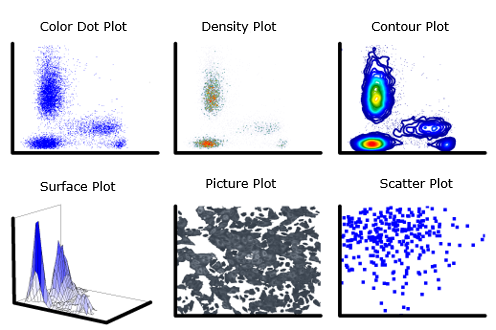
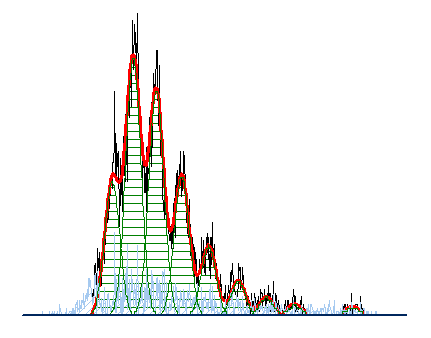
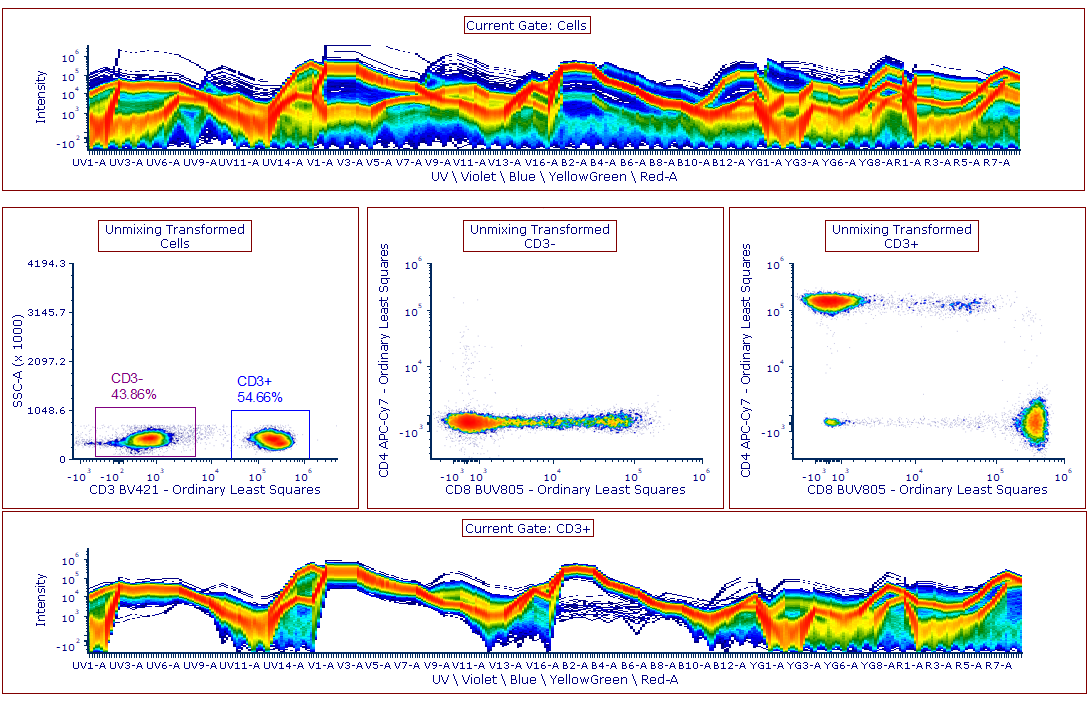
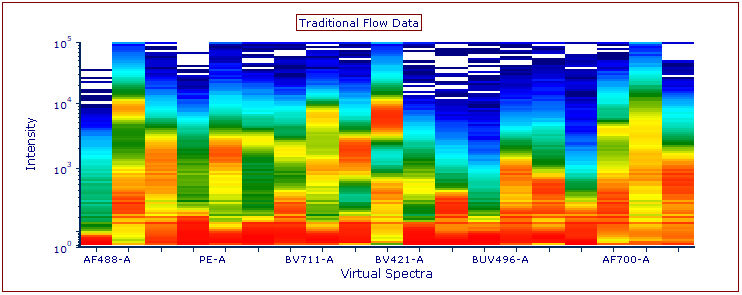
FCS Express provides the capability to read raw spectral data from Cytek and Sony instruments in the 1D plot type, Spectrum Plots, for the analysis of spectral data. FCS Express also supports spectral unmixing from single stained controls. Data can be presented in the spectrum plot with numerous density, line, and backgating options to optimize displays for analysis. The color of each line can reflect the color of the gate in which the event falls effectively providing backgating information for spectral data. Multiple populations or files may also be overlaid with ease.

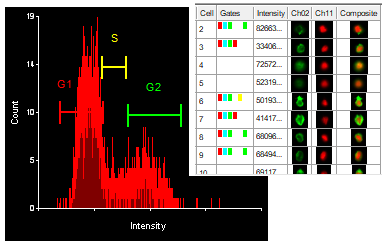
Gates are applied easily to Spectrum Plots with drag-and-drop as demonstrated in the example below.