Gates and parameter heat maps allow you to create an array style heat maps for gated populations across multiple data files. Array maps are fully formattable to help you arrive at a publication ready representation of you data quickly and easily. Represent heat based off of many common statistics, create threshold based heat maps, and even represent the size of the array well based on separate statistics.
 |
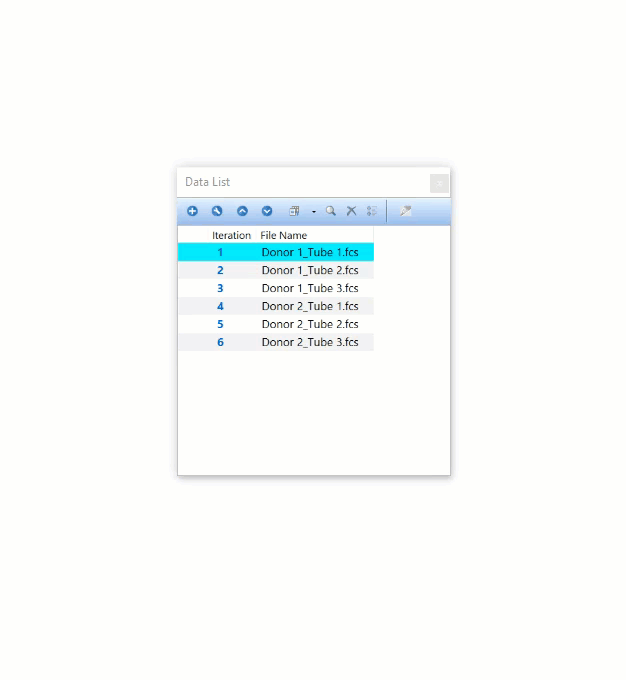
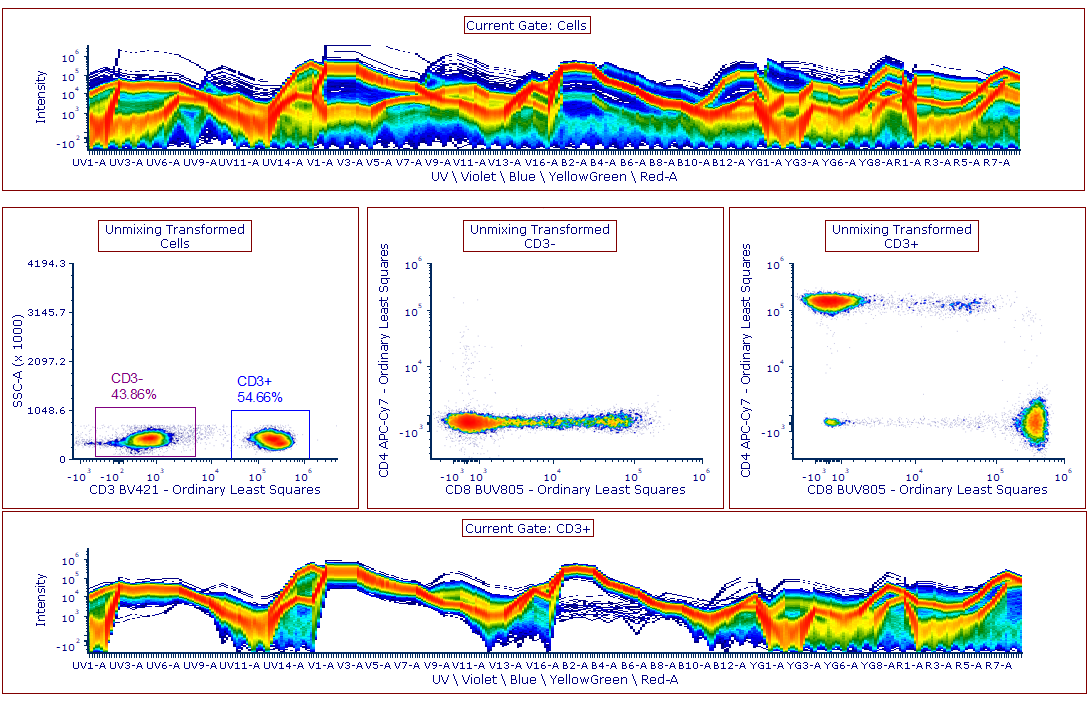
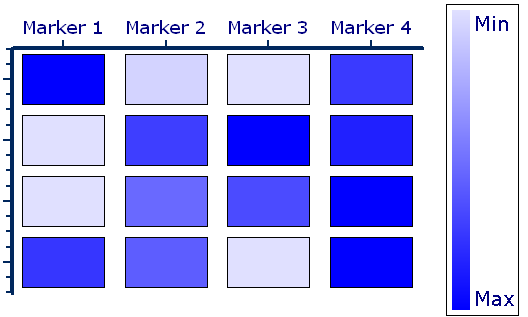
A gates heat map will plot any number of samples arranged on the Y axis against any number of gates arranged on the X axis. Many standard descriptive statistics may be chosen from to represent the heat displayed in each square of the array map. |
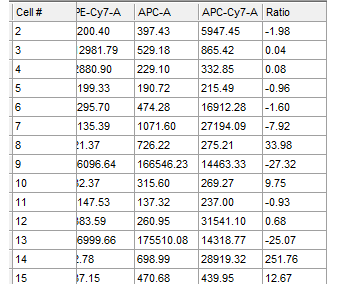
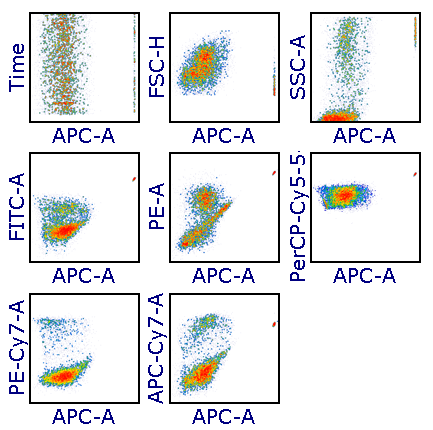
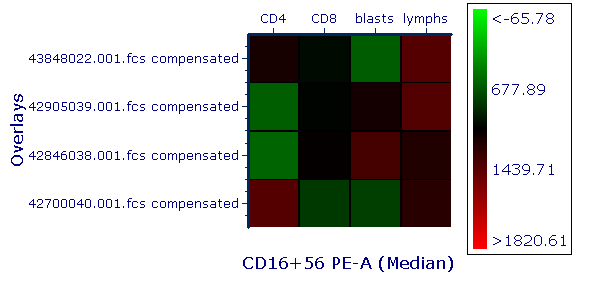
| A parameter heat map will plot any number of samples arranged on the Y-axis against the acquisition parameters on the X-axis. A gate can be applied to investigate populations of cells. Many standard descriptive statistics are available for selection to represent the heat displayed in each square of the array map. | 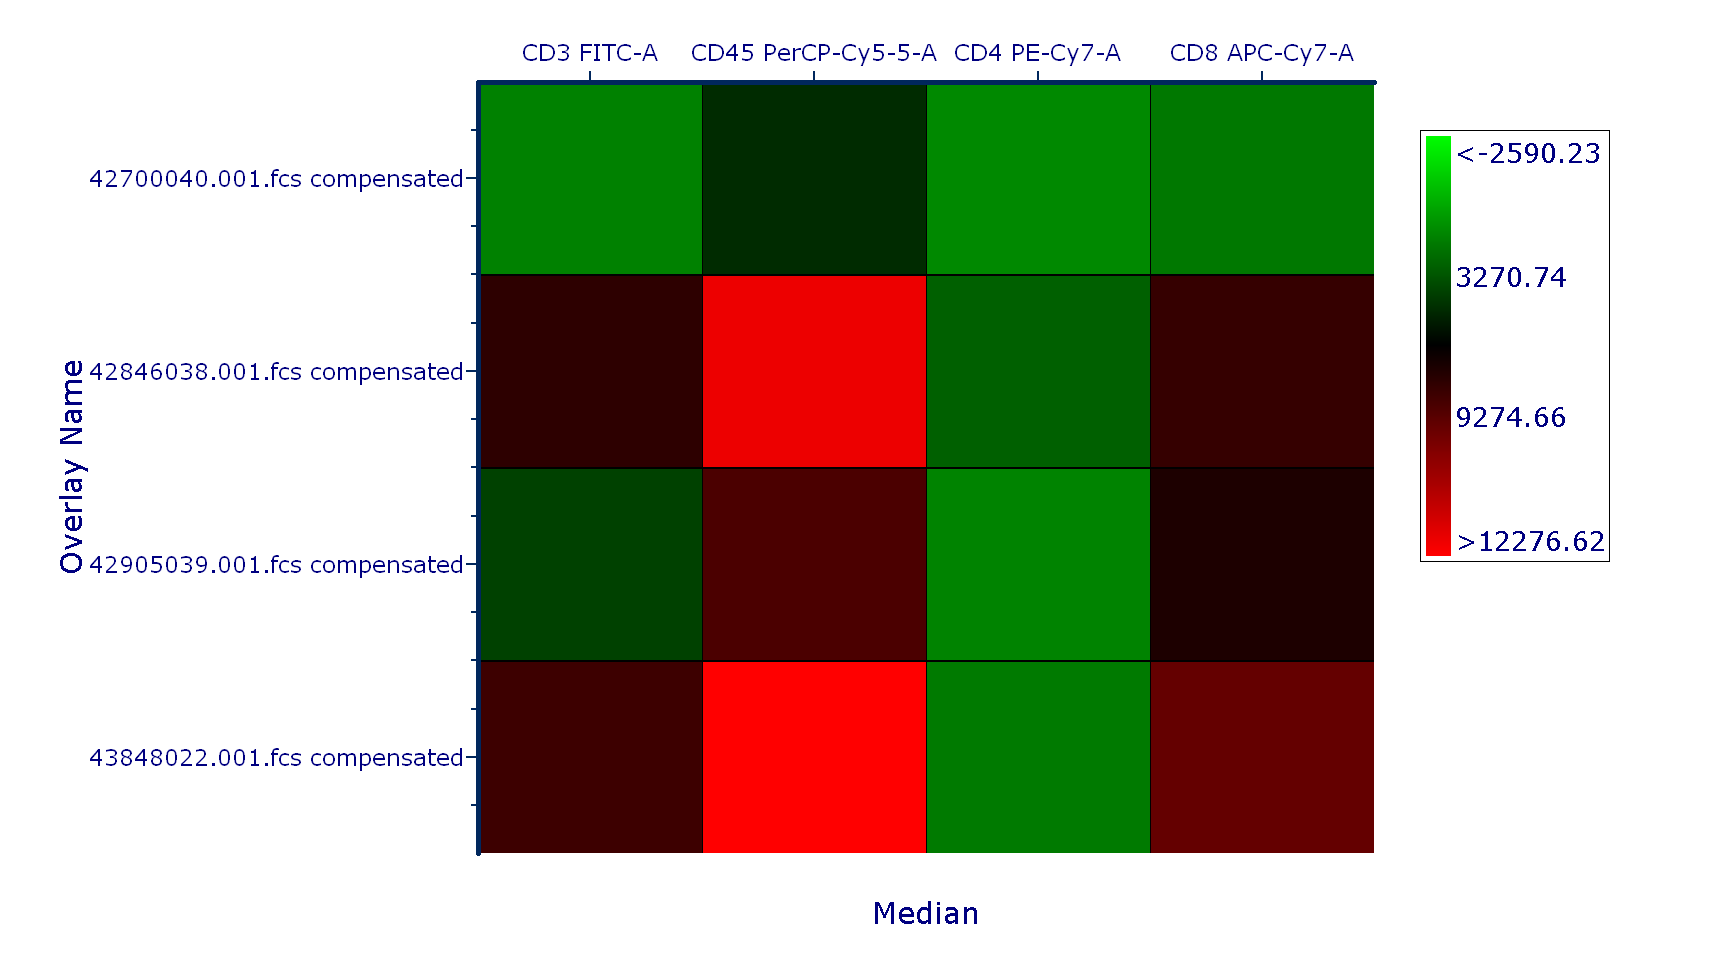 |
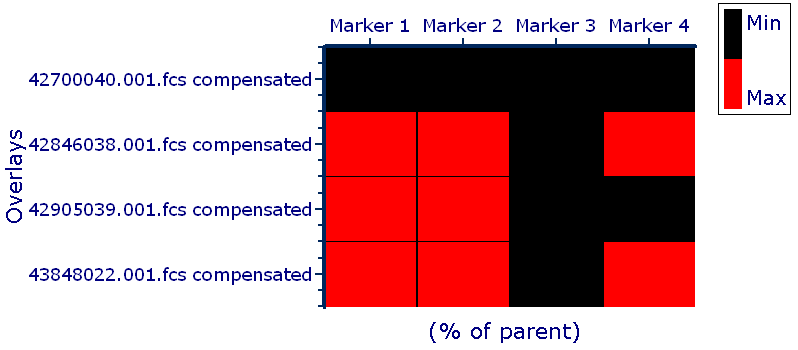 |
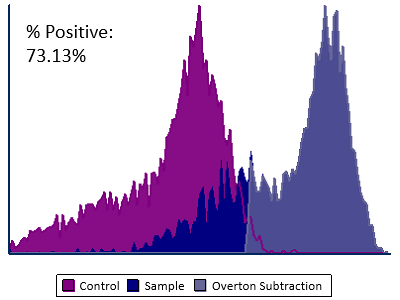
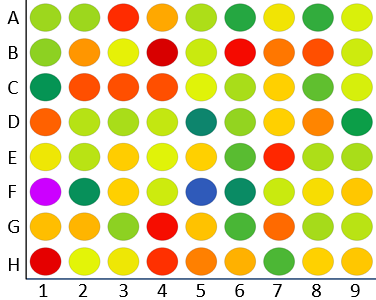
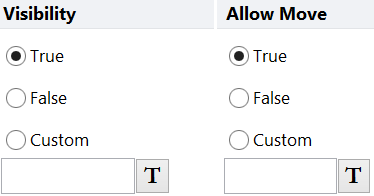
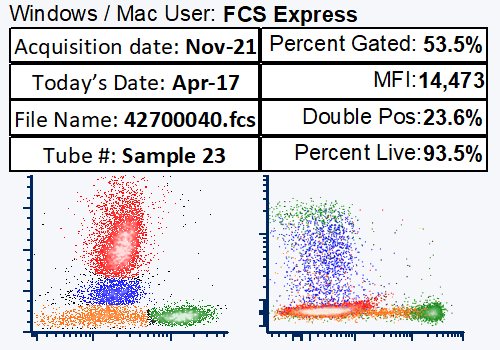
Gates and parameter heat maps are fully formattable with a number of color scalings available. In the example to the right a threshold mapping was created to display array squares above a certain percent gated in red and values below the value in black. |
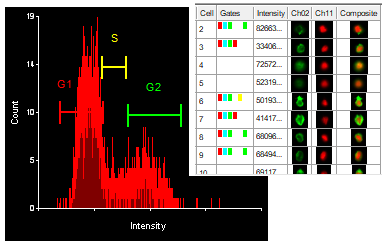
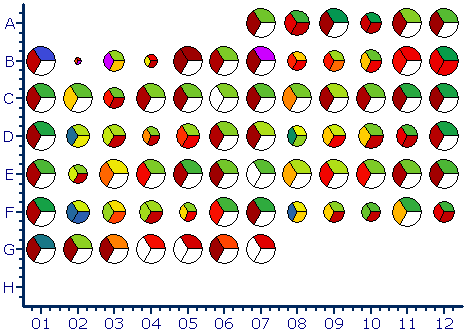
| Gates and parameter heat maps also allow you the flexibility to derive a statistic to represent the size of the array square. In the example to the left the array square size is based on the number of events in each gate while the green shading is based on the MFI values of each gated population. | 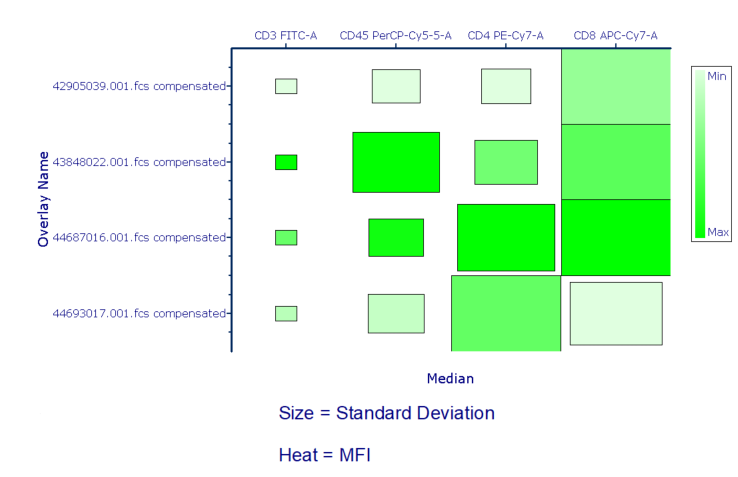 |