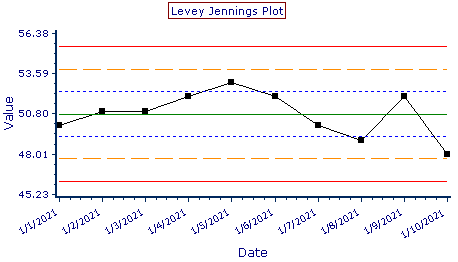
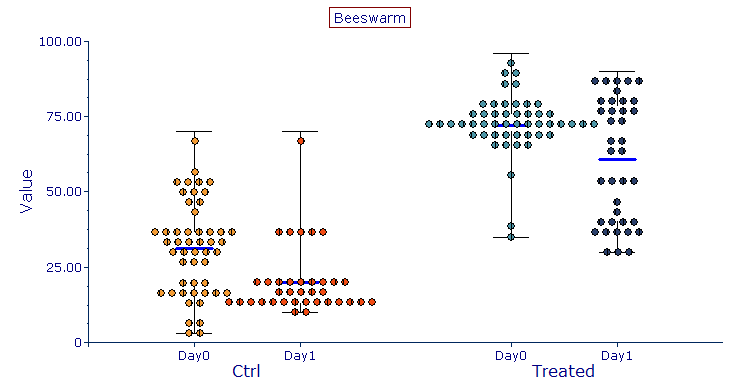
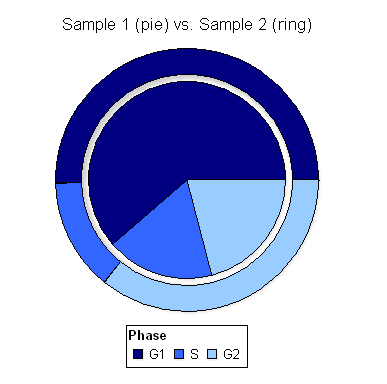
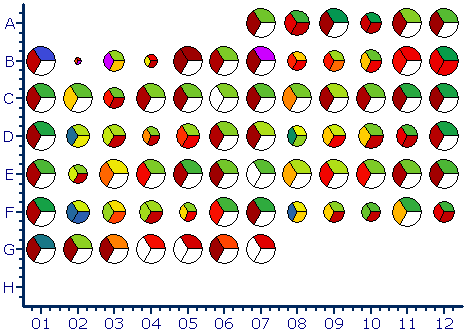
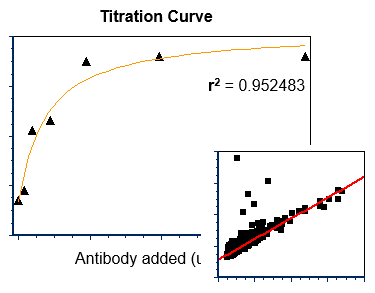
Most researchers spend a lot of time exporting data to Excel or other spreadsheet software in order to make graphs to summarize data. With other software packages if the data changes, due to a change in gating strategy, one would have to re-export all data after updating the analysis and recreate the graphs. FCS Express has built-in Bar, Box and Whisker, Violin, Beeswarm, Levey Jennings, Pie, Scatter, and Scatter with Regression Plots, which update immediately based on integrated spreadsheets and tokens so as your gates and data change your final results in charts and graphs update immediately taking you from your raw data to final results in record time.