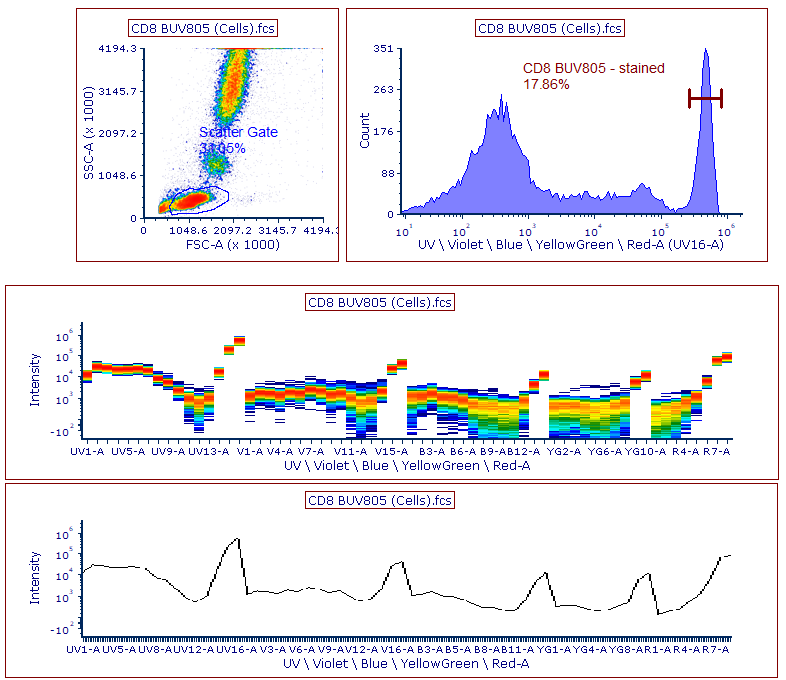
Take advantage of the only third-party software capable of displaying your spectral data from Cytek and Sony instruments.
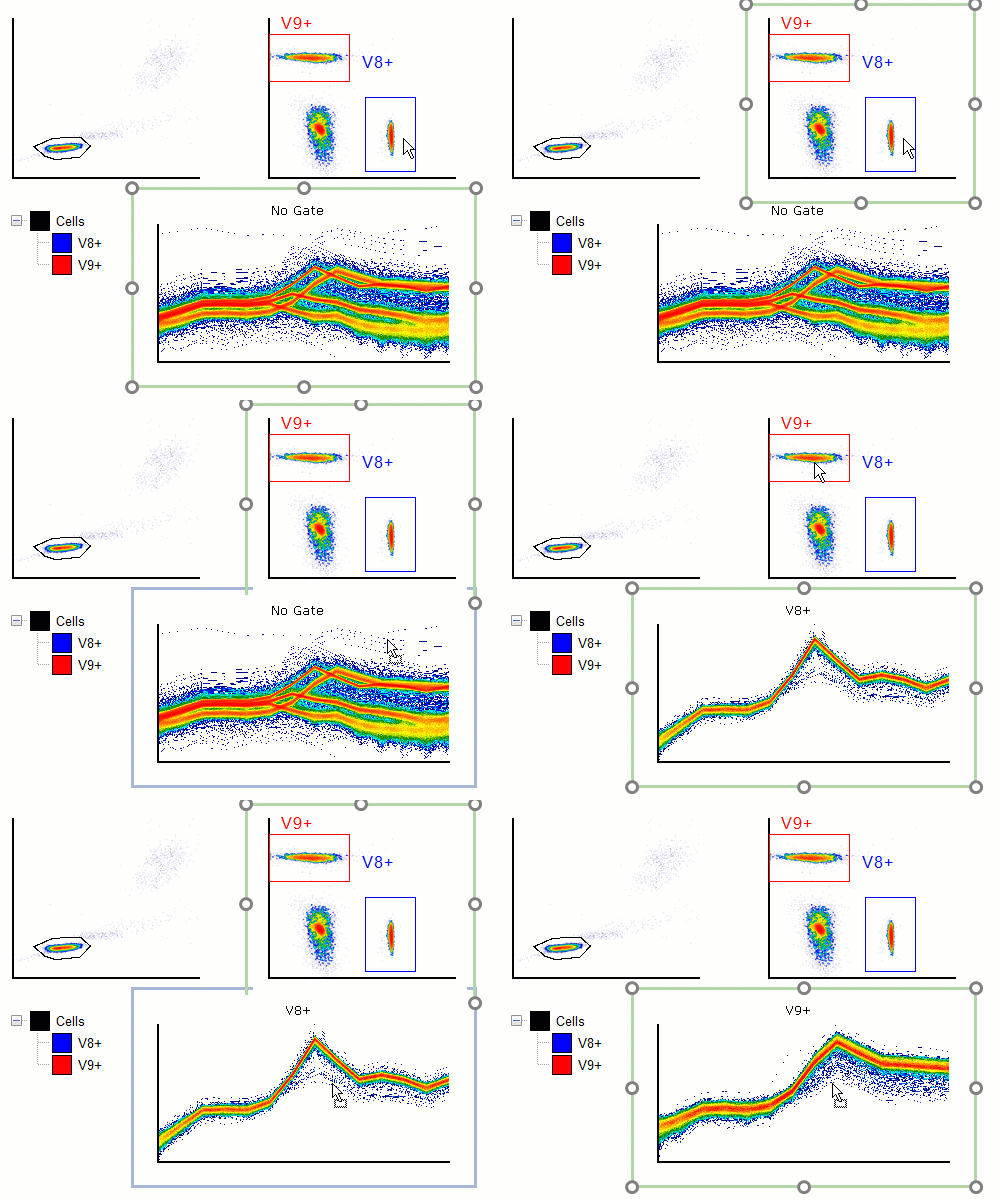
| Apply gates to visualize subsets of interest along spectra. |
 |
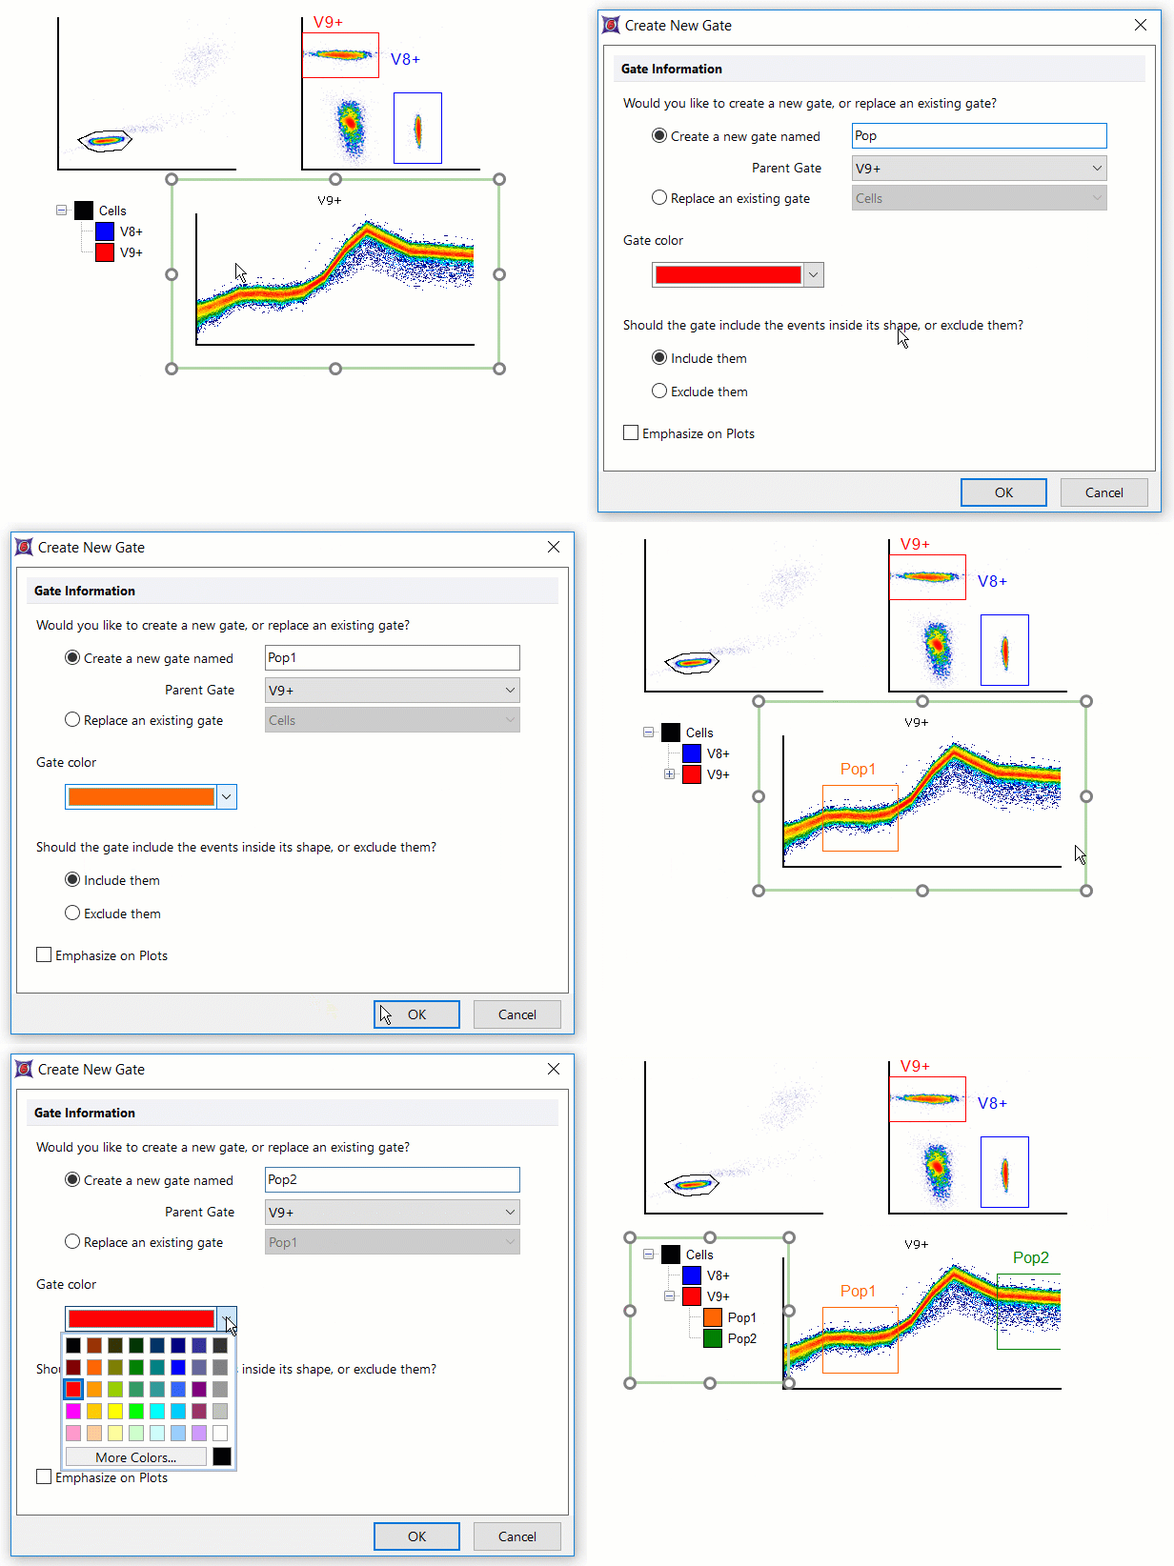 |
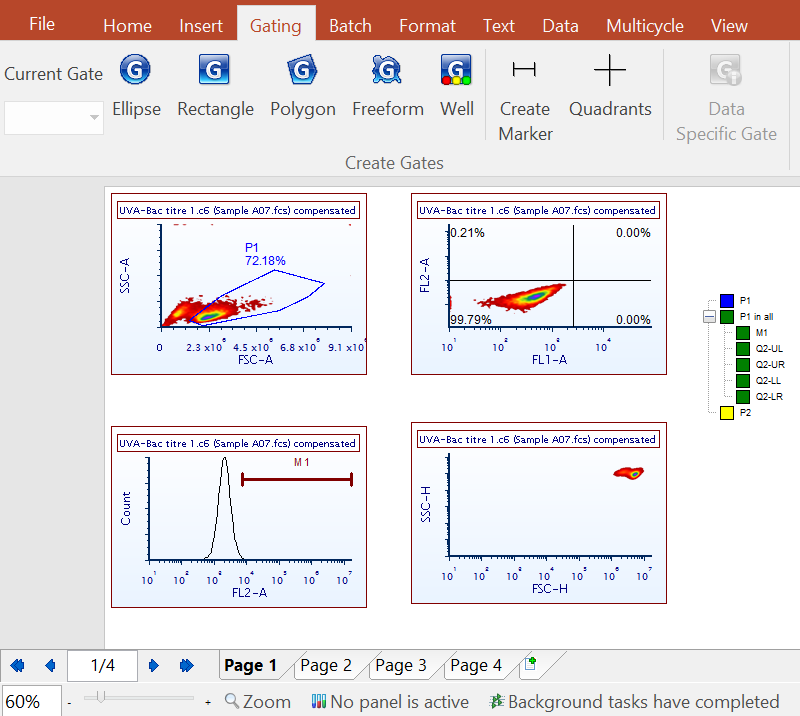
Create gates to analyze populations further or backgate on other plots. |
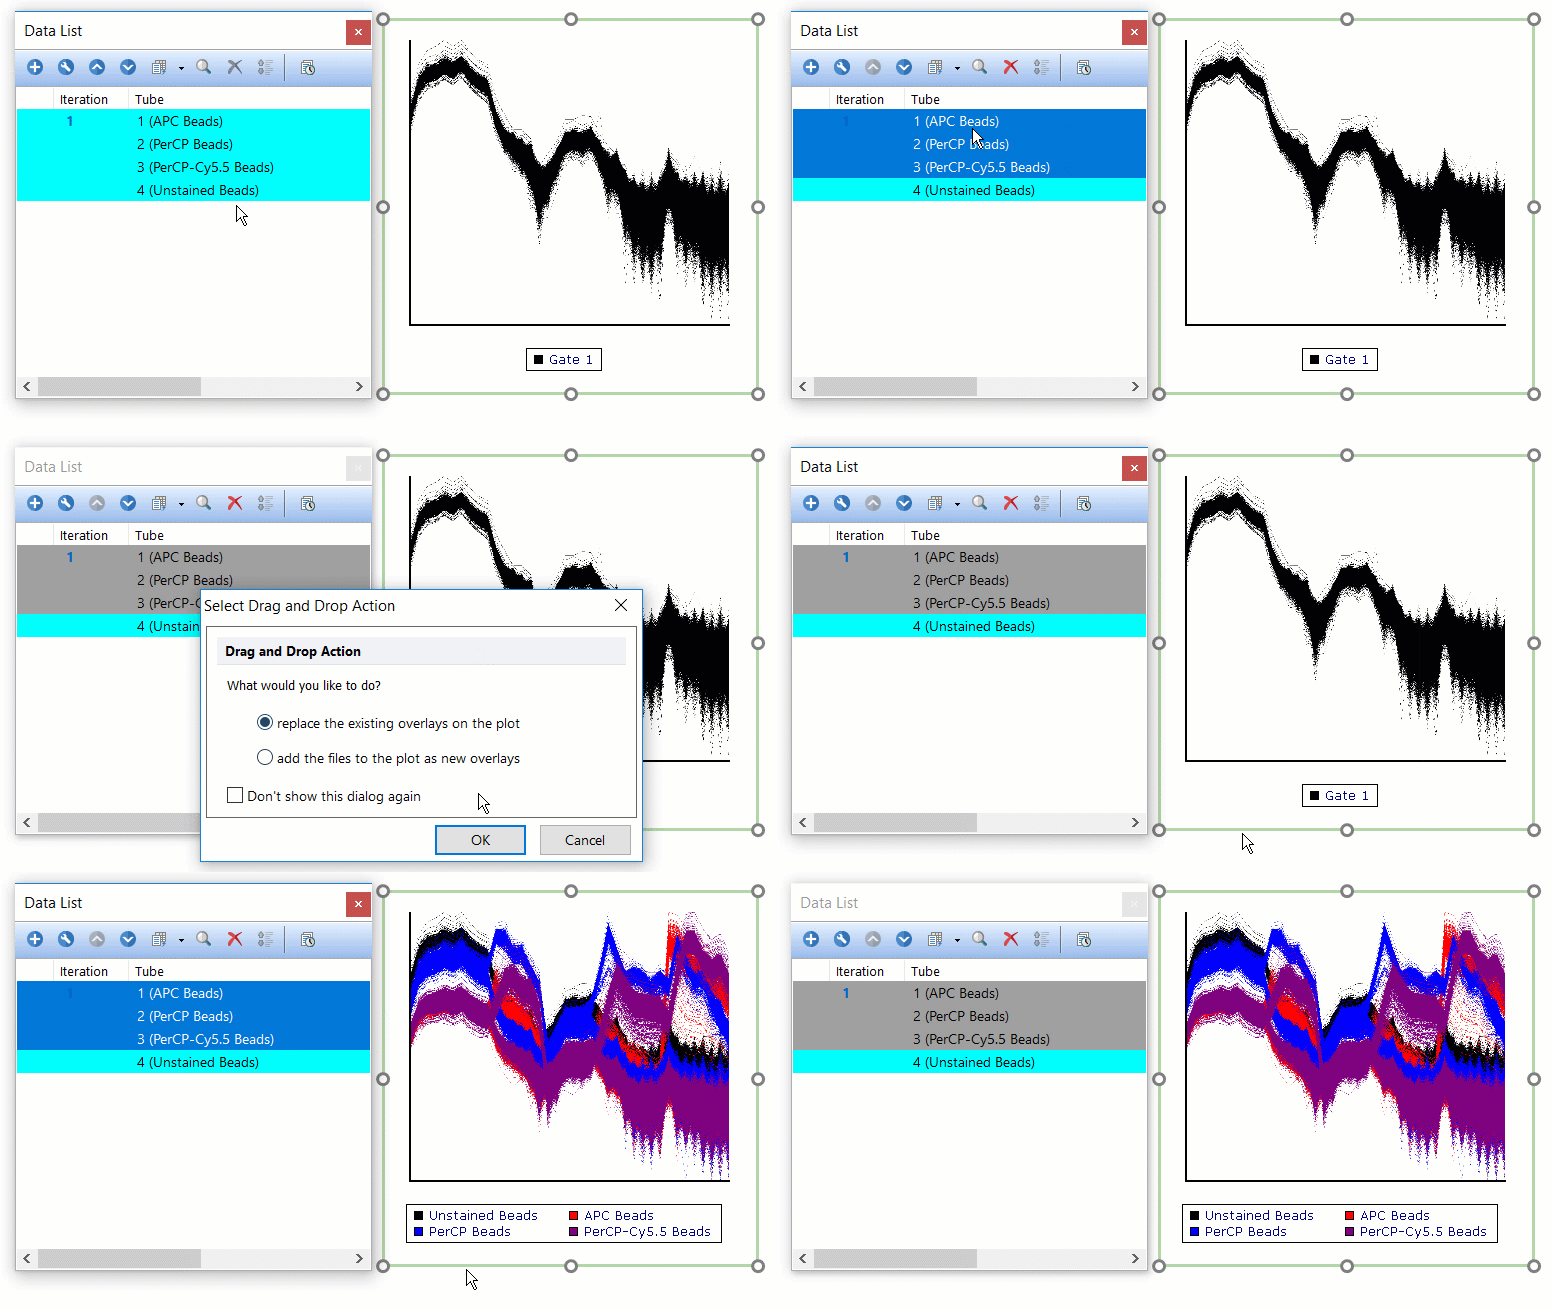
| Overlay multiple samples or populations in a single plot for easy visual comparison. |
 |
 |
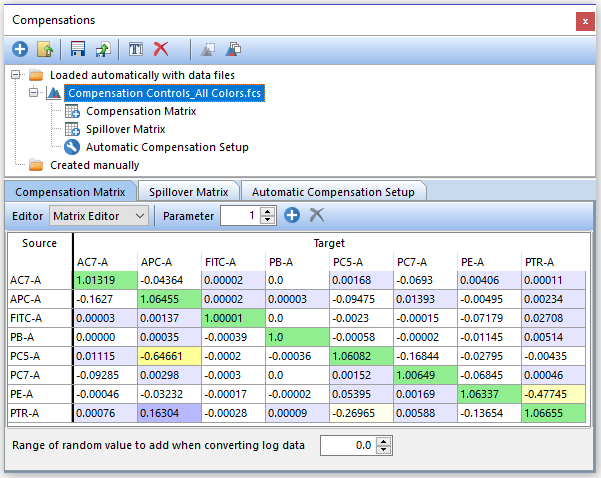
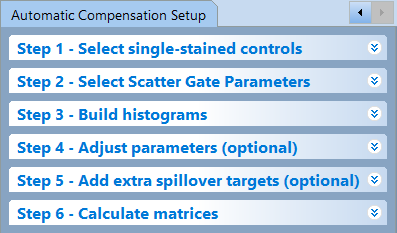
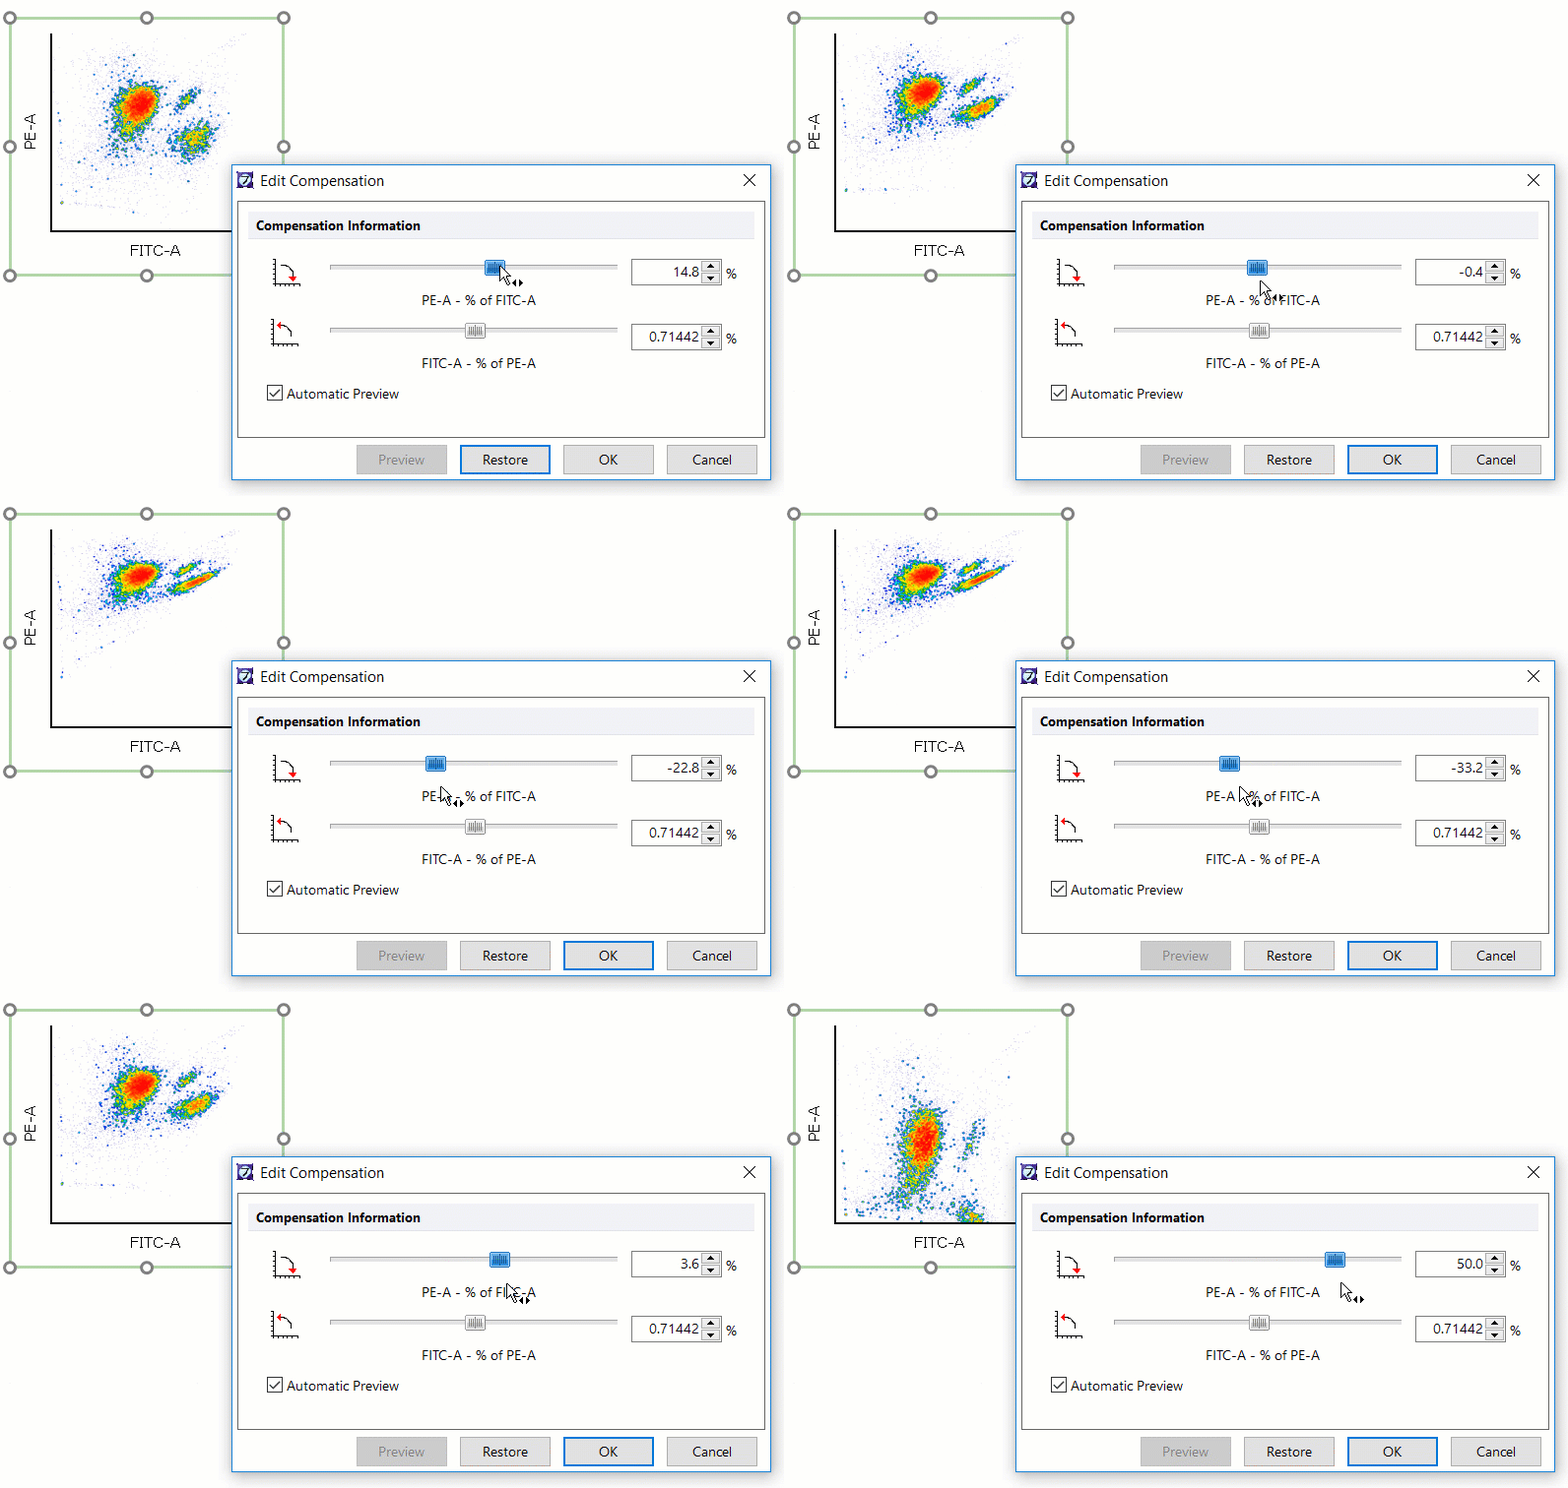
Perform Spectral Unmixing from single stained controls directly in FCS Express. As adjustments are made to the compensation setup, and/or directly to the matrix, your flow cytometry analysis will update immediately to help you visualize changes based on your controls without delay. |
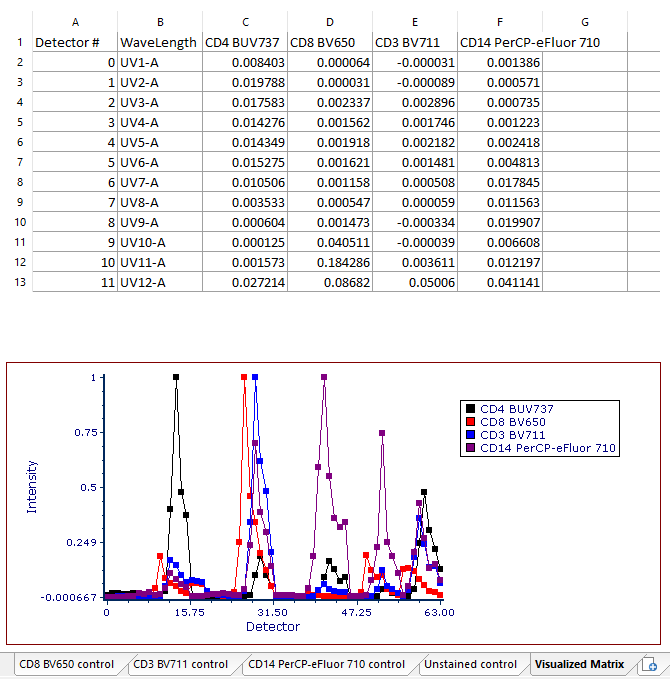
A Visualized Matrix can also be created for any created or imported unmixing matrix added to a layout. FCS Express will automatically generate a Visualized Matrix by simply using a right-click on the desired unmixing matrix in the Compensation and Unmixing editor by choosing Build Visualized Matrix. The Visualized matrix page includes a spreadsheet with charted values and a chart displaying the Detector vs Intensity for each single stained control added in the Automatic Unmixing Setup.
FCS Express makes it easy and convenient to view unmixed spectral signatures. The Visualized Matrix is one of many new features that takes your analysis in FCS Express to the next level.
Spillover Spreading Matrix (SSM) and Cross Staining Index (CSI) matrix are both automatically calculated at the end of the Compensation/Unmixing wizard.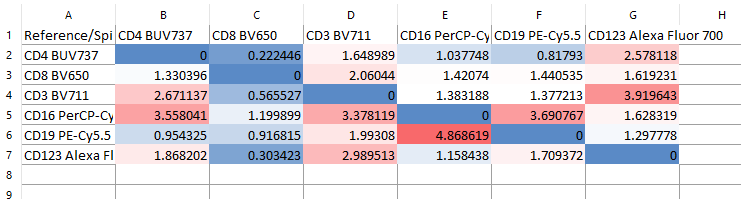
 Explore the Scientific R&D Software
















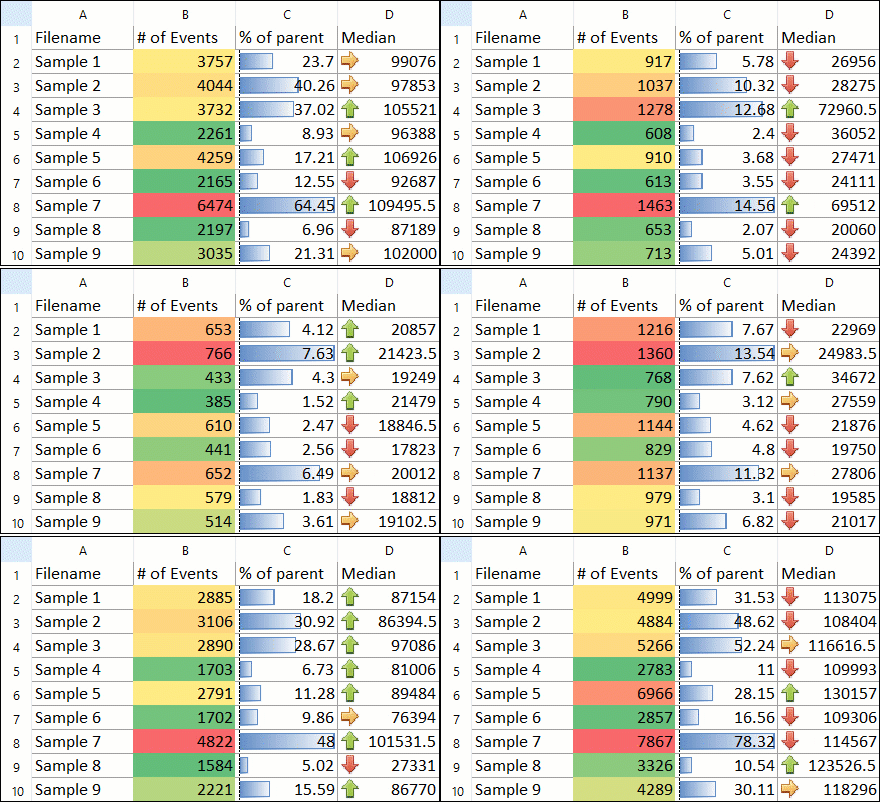
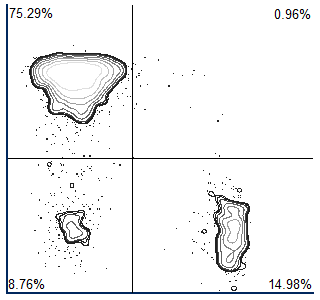



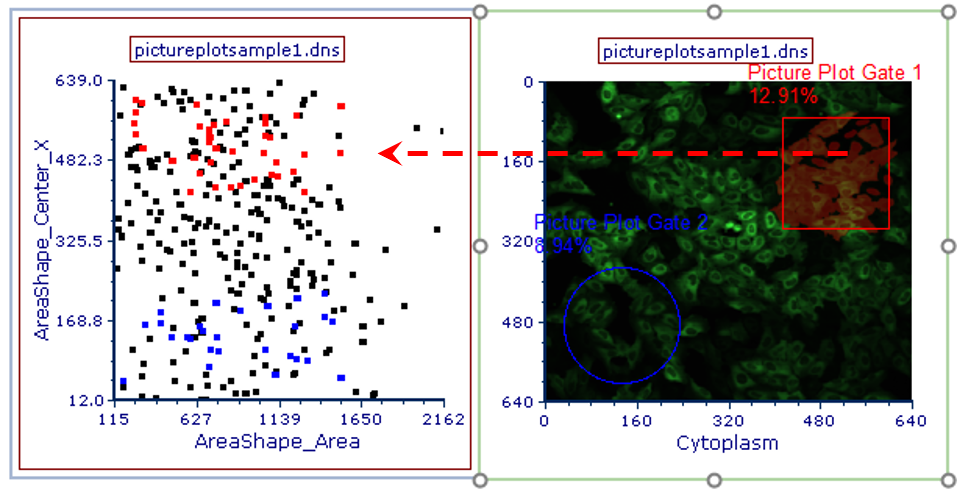
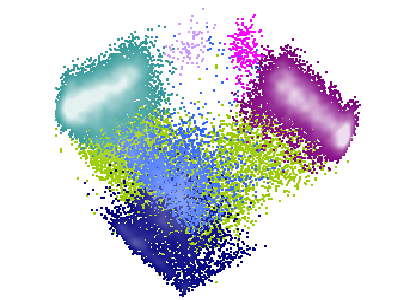





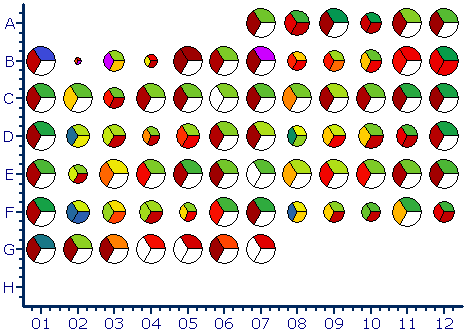
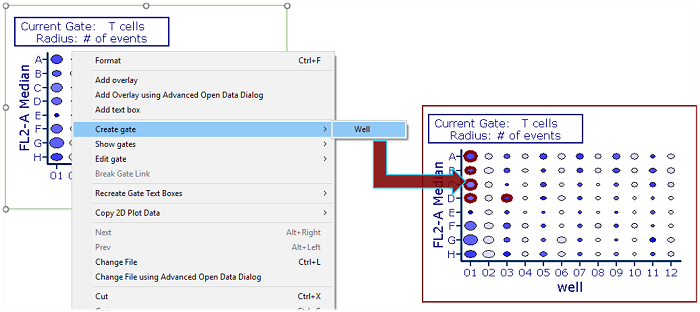
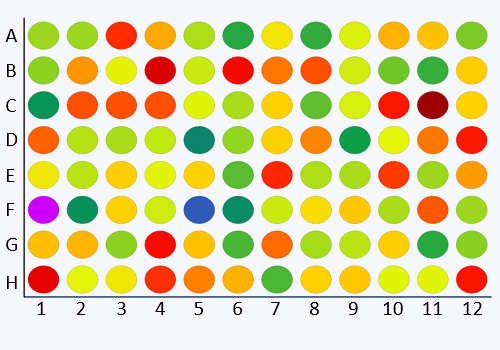
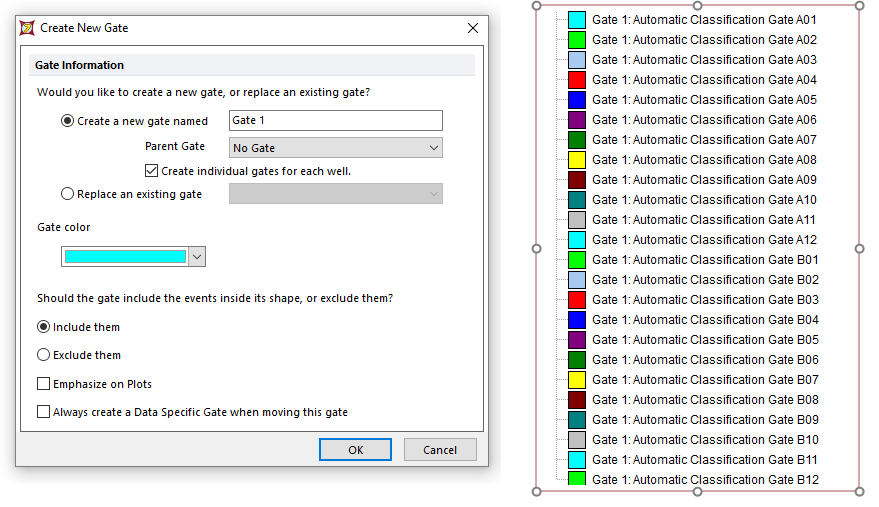 Let FCS Express create gates automatically for all or selected wells and clusters from your heat map.