High Content Tools for Flow and Image Cytometry Data

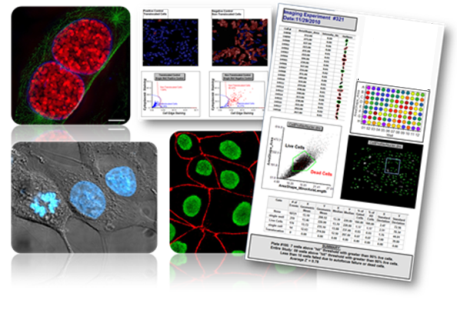
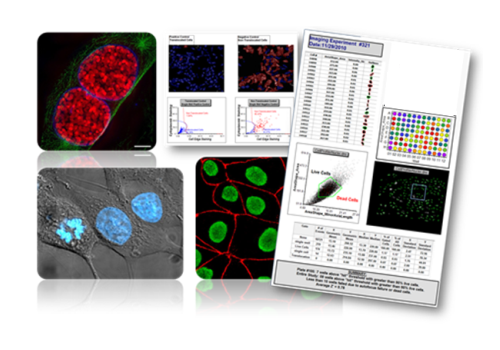
FCS Express continues to lead the field by providing cutting edge high content visualization tools. FCS Express supports heat map plots for displaying plate based data, index sorting, high content screening, high content analysis, for flow and image cytometry data analysis.

Please note that the High Content is not necessary to visualize high dimensional data reductions/pipeline outputs


Jump to HCS for Flow Cytometry Data

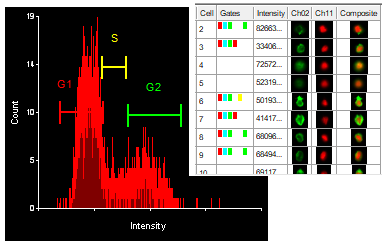
Jump to HCS for Image Cytometry Data


indexsortingheatmap

High Content For Flow Cytometry Data Analysis

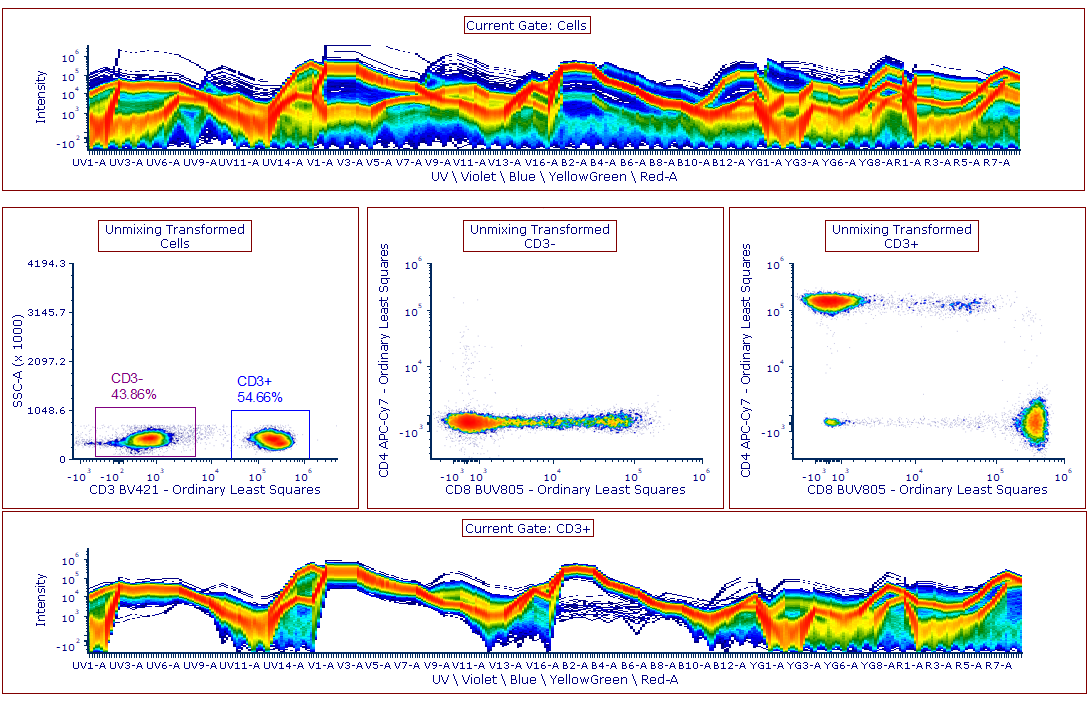
FCS Express continues a legacy of innovation in the field by providing analysis capabilities for multiwell plate format flow cytometry data from the following instruments:

  • Bio-Rad ZE5
  • BD HTS
  • Guava
  • Coulter Quanta
  • MACSQuant
  • Hypercyte
  • Sony
  • Accuri

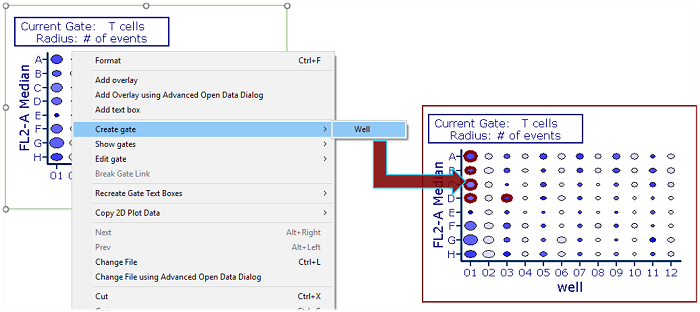
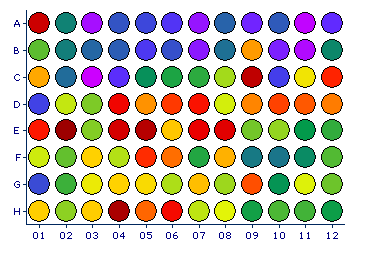
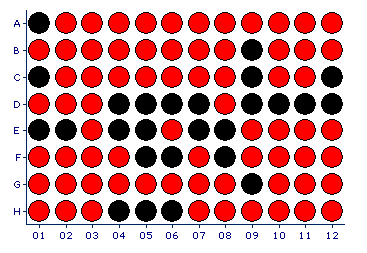
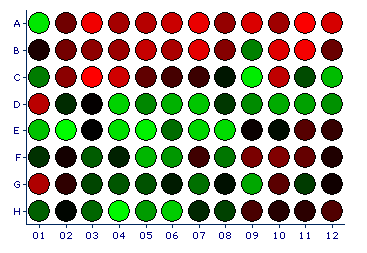
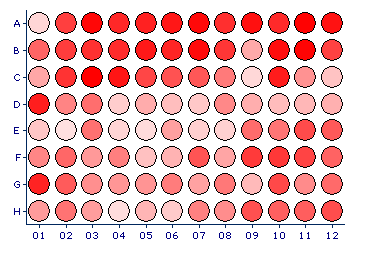
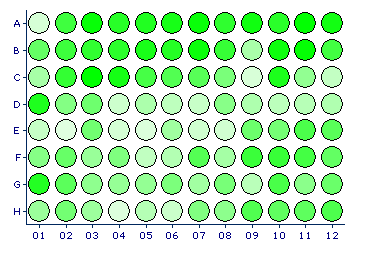
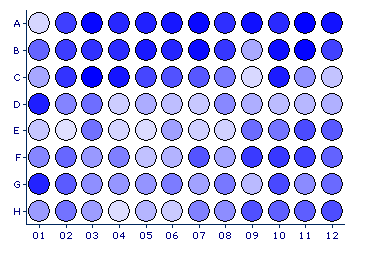
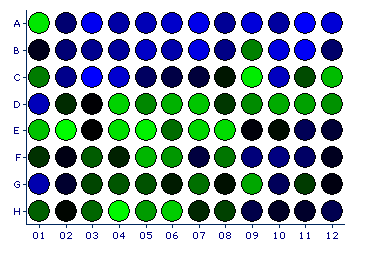
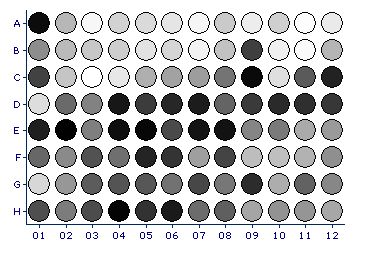
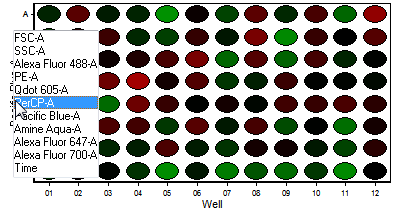
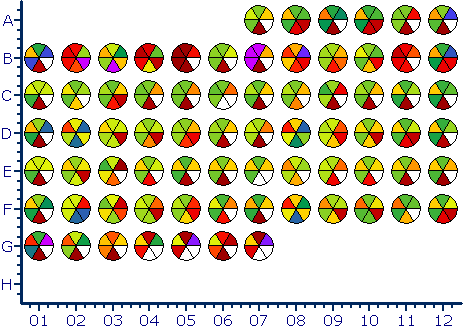
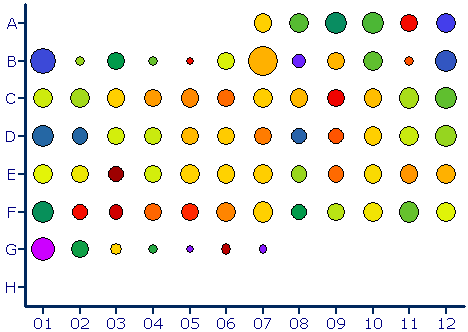
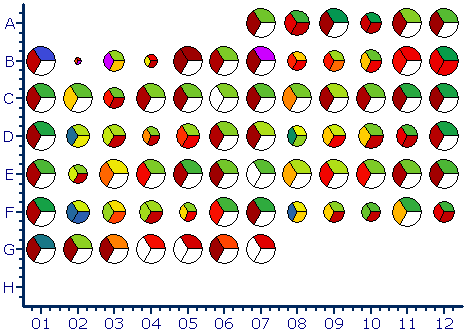
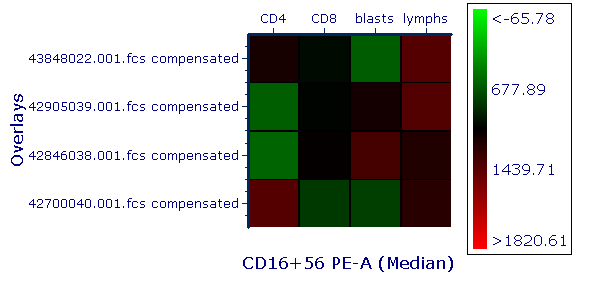
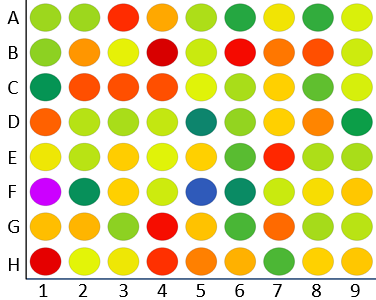
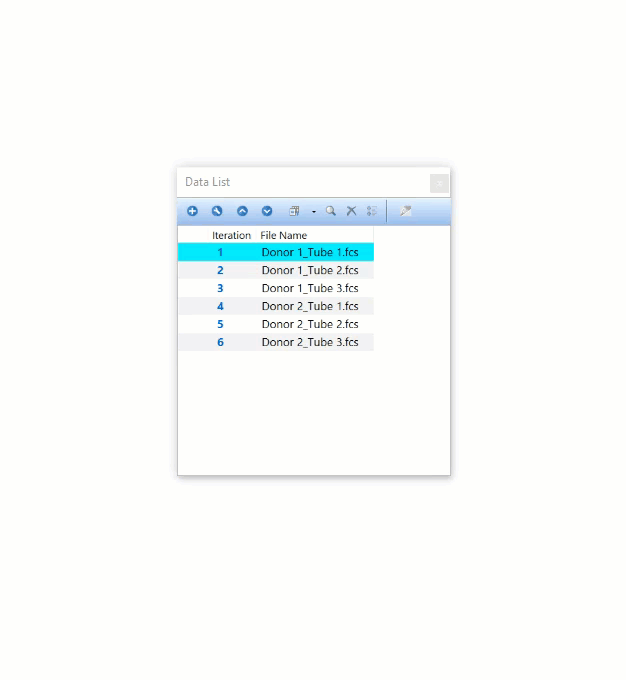
The imported data can be displayed on a per-well basis or as an entire plate in Heat Map format.

Index Sorting is also supported for:

  • Influx (BD Biosciences)
  • Summit Software (Beckman Coulter)
  • Diva (BD Biosciences)
  • Chorus (BD Biosciences)

High Content for Image Cytometry Data Analysis

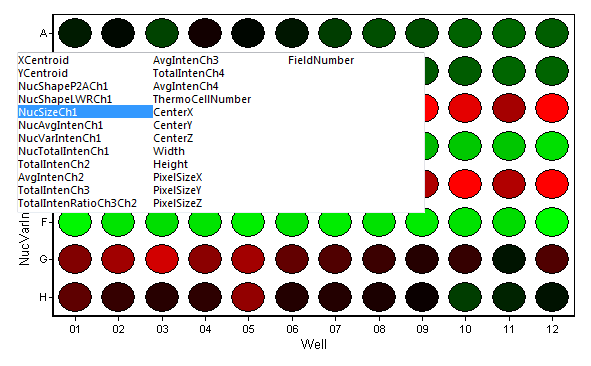
Data for heat maps can be generated from many manufacturers such as Cell Profiler, Nexcelom Celigo, Thermo ArrayScan, and more Image Data Format Compatibility is being added all the time.

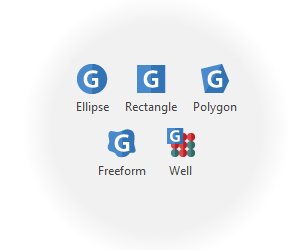
Heat maps allow the user to:
  • Plot any statistic on any parameter.
  • Represent different files, statistics, or parameters simultaneously with multiple Heat MapsHeat Map Overlays, or a Heat Map Radius (right).
  • Apply any kind of gate to Heat Maps, including well gates; wells can then be individually examined as any other type of plot that FCS Express supports.
  • Work with High Content Screening or High Content Analysis data sets.
  • Complete control over plate formatting and displays.
Feature Support

Have Questions? Get Help.

Manual and Tutorials

High Content Tools in the FCS Express Manual

Video Resources

High Content Tools On demand video content