Plot Types and Custom Formatting

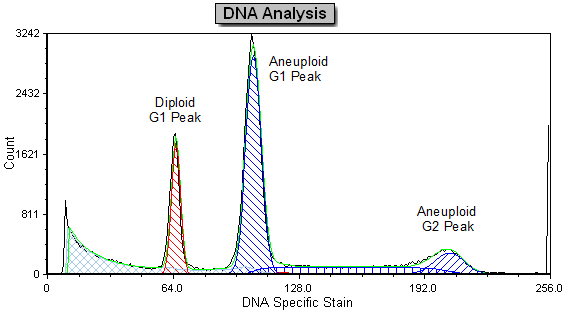
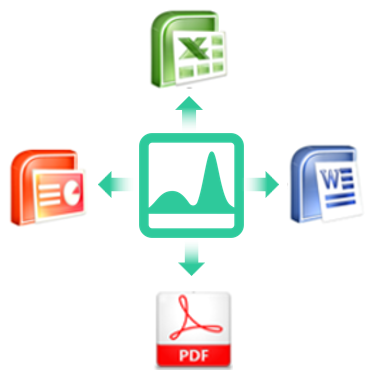
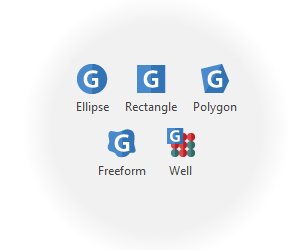
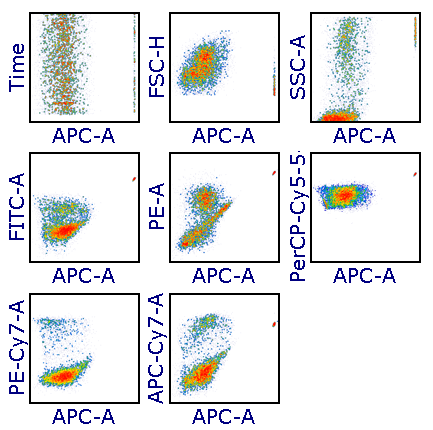
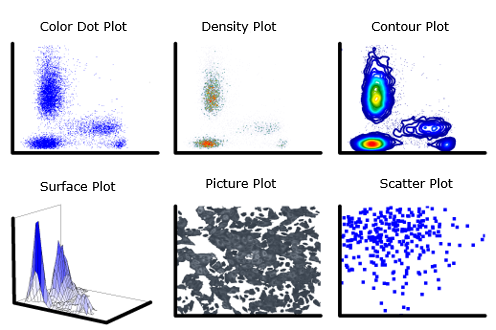
FCS Express supports many different visualizations for your data sets:

  • Dot or Color Dot - Shows all events on your plots in any color or with any backgating you want.
  • Density - Shows all the events with different colors representing the density of the events at a given position.
  • Contour - Same as density plots, except the density of the events is displayed as contour lines.
  • Histogram - Displays events on one dimension with overlays accessible at anytime.
  • Surface - Shows a 3D surface view of the events.
  • Picture - Shows an image which links to events on other plots that may be gated and treated like any other plot.
  • Heat Map - Displays plate-based experiments as multi-well plates with coloring based on heat mapping.
  • Scatter plot - Perfect to display custom data and to perform regression analysis.

Click on the plots below to see a larger view or better yet, try with your own data by downloading a free 30 day trial of FCS Express.

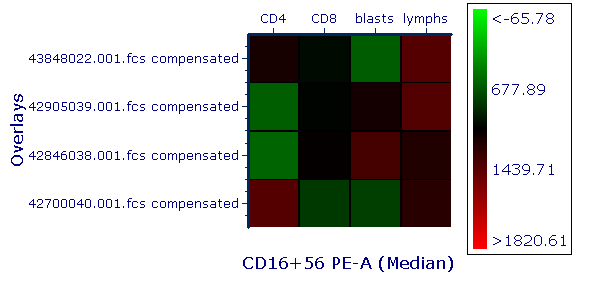
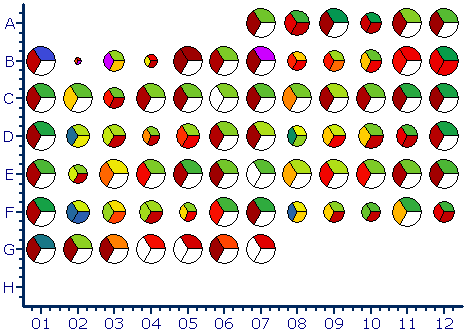
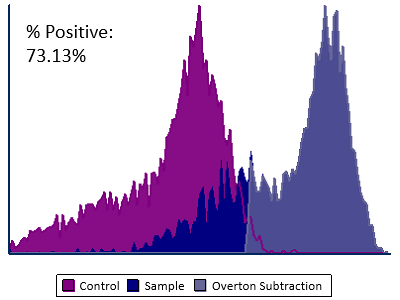
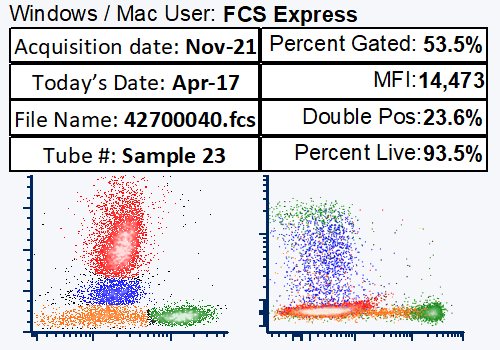
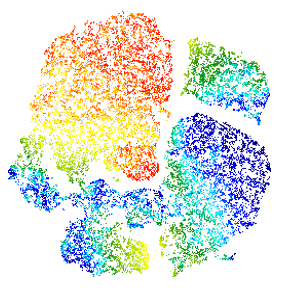
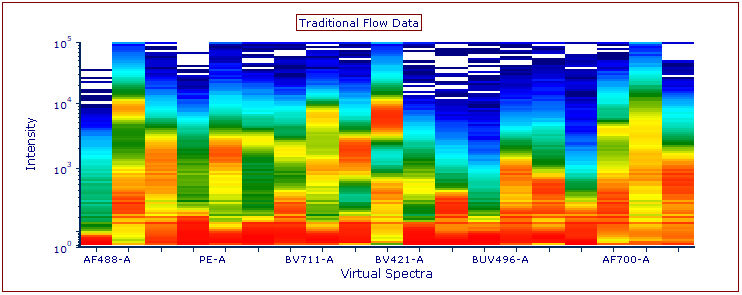
Every aspect of your plots can be easily customized in FCS Express. This includes scalings, ticks, labels, dot size, colors, fonts, legends, and more. Nearly everything you see on the screen is under user control.

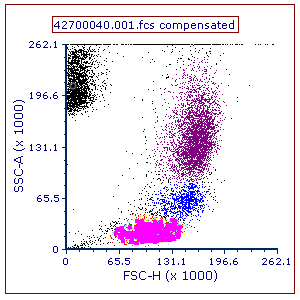
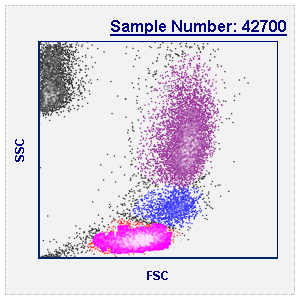
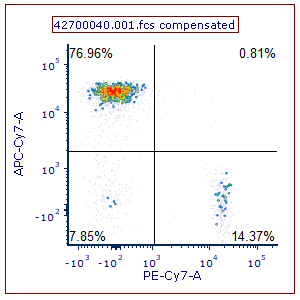
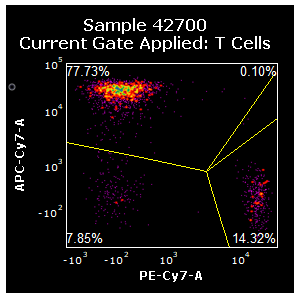
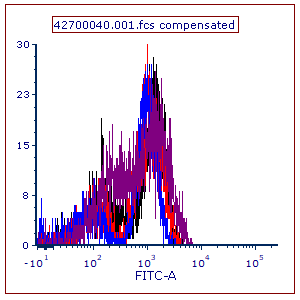
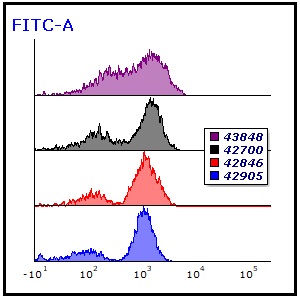
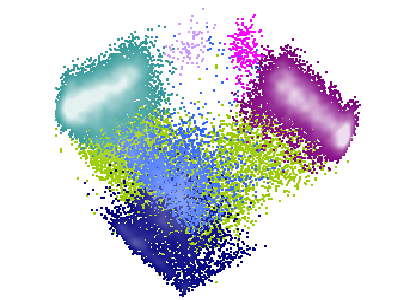
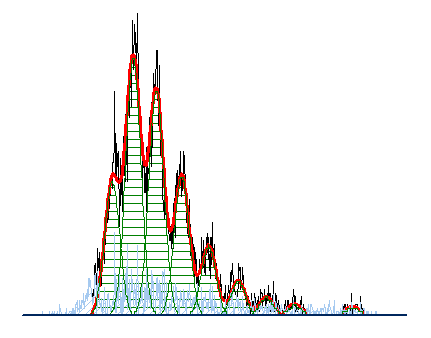
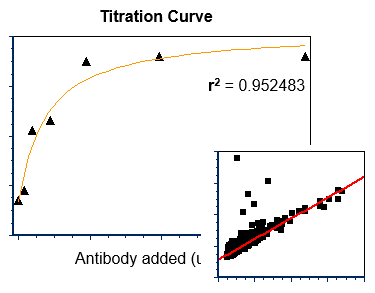
See the results for yourself! In the images below, the default plot type is depicted on the left, and on the right that same plot has been customized.

Default Color Dot Plot

Customized

Customizations:

  • Dot Size
  • Background
  • Density Shading
  • Fonts
  • Title
  • Axis Labels
  • Axis Ticks
  • Border
  • and more...

Default Density Plot

Customized

Customizations:

  • Background
  • Resolution
  • Smoothing
  • Outlier Size
  • Quad Type
  • Magnified
  • Fonts
  • Title
  • and more...

Default Histogram

Customized

Customizations:

  • Resolution
  • Smoothing
  • Transparency
  • Overlay type
  • Magnified
  • Fonts
  • Title
  • Legend
  • and more...

In addition, plots can be displayed in greyscale or black and white for publication-quality images.

Feature Support

Have Questions? Get Help.

Manual and Tutorials

2D Plots in the FCS Express Manual

Video Resources

2D Plots On demand video content