
Scientific intelligence platform for AI-powered data management and workflow automation
Statistical analysis and graphing software for scientists
Bioinformatics, cloning, and antibody discovery software
Plan, visualize, & document core molecular biology procedures
Proteomics software for analysis of mass spec data
Electronic Lab Notebook to organize, search and share data
Modern cytometry analysis platform
Analysis, statistics, graphing and reporting of flow cytometry data
Intelligent panel design & inventory management for flow cytometry
FCS Express is one of the premier tools for analysis and reporting of your flow cytometry data. The application examples below illustrate how FCS Express can be used to create stunning reports while easily performing complex analysis.
Jump to Image Cytometry Applications.
Would you like to see your Flow Cytometry Application in this list? If so please email us at support@denovosoftware.com.
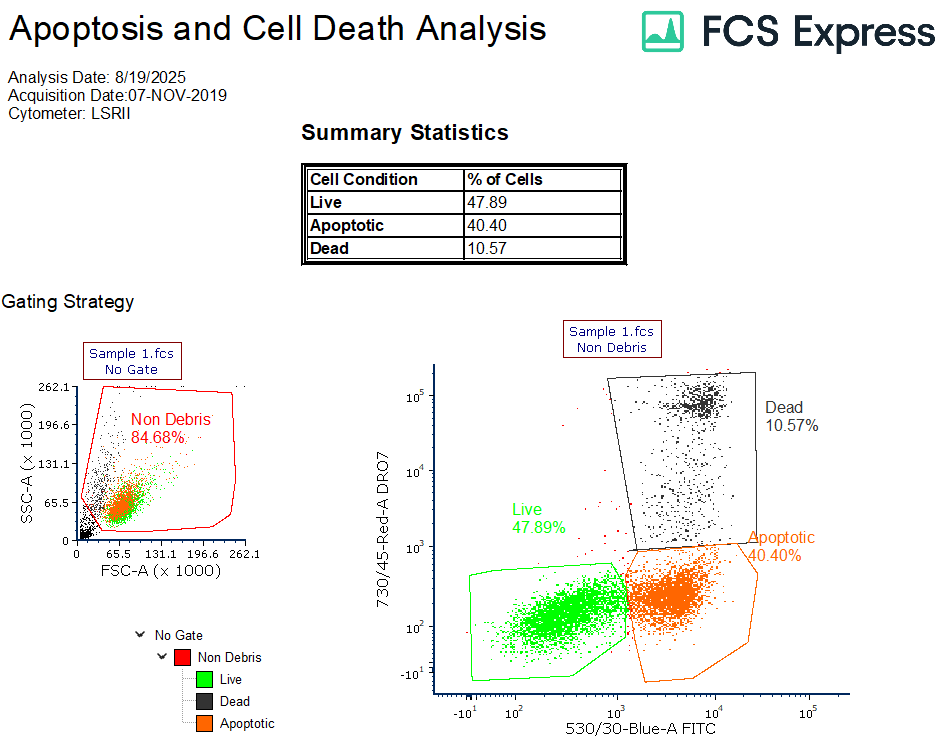
Help Automate your Apoptosis Experiments with FCS Express
The Apoptosis and Cell Death Template in FCS Express provides users with an easy to use analysis template to evaluate and report their Apoptosis results. Open the layout and walk through the Startup Script to select the files, scatter parameters and your Apoptotic and Cell Death Markers. After loading your data you can adjust or replace the gates as needed.
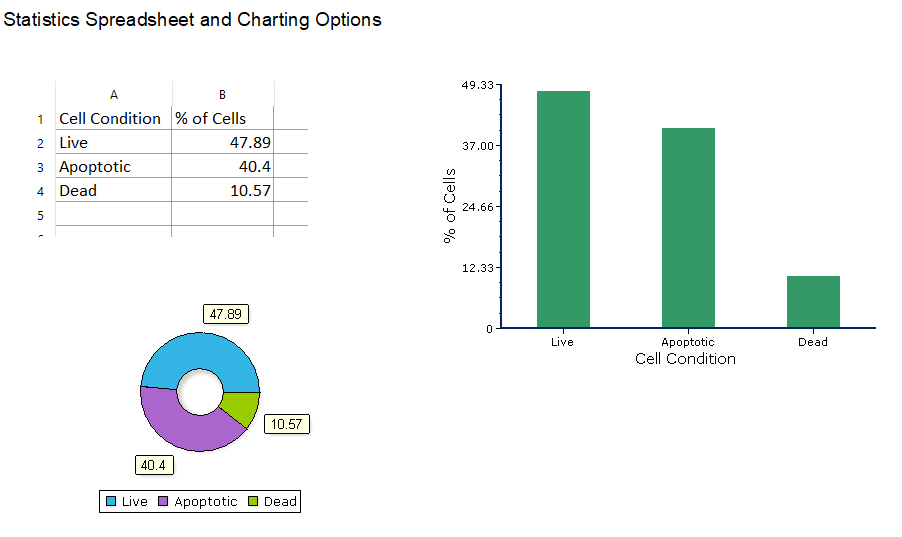
With minimal clicks, FCS Express will populate a scatter plot to help remove unwanted events then use dots plots to select your Live, Apoptotic and Dead populations. This automatically generates a bar chart and a pie chart using Integrated Spreadsheet. With a single click on the Run icon from the Batch & Export tab, batch processing will promptly export analysis report files for you. Further customize your reports, exports, and analysis as needed.
Using this template can help get you from your raw data to an analyzed report easily.
Download the Apoptosis and Cell Death Template
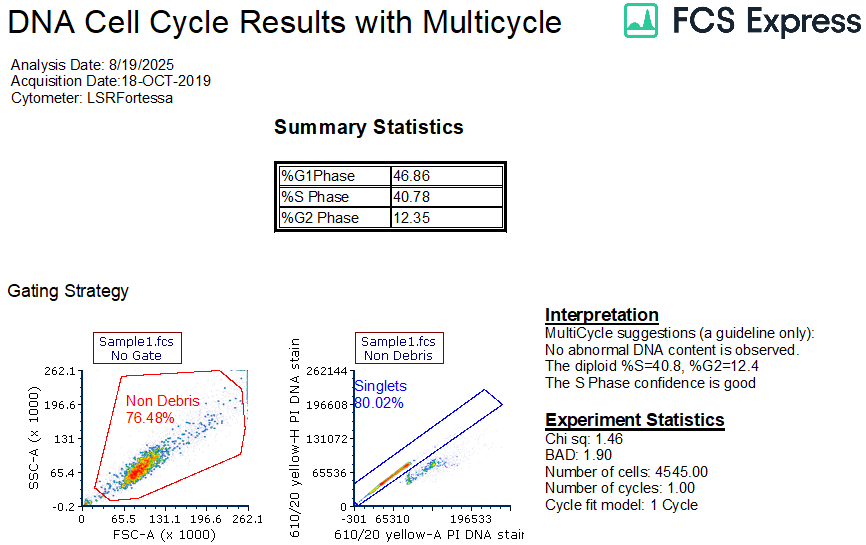
Help Automate your Cell Cycle Analysis with FCS Express
The DNA Cell Cycle Results with Multicycle Template in FCS Express provides users with an easy to use analysis template to evaluate and report their Cell Cycle results. Open the layout and walk through the Startup Script to select the files, scatter parameters and your DNA Stain Markers. After loading your data you can adjust or replace the gates as needed.
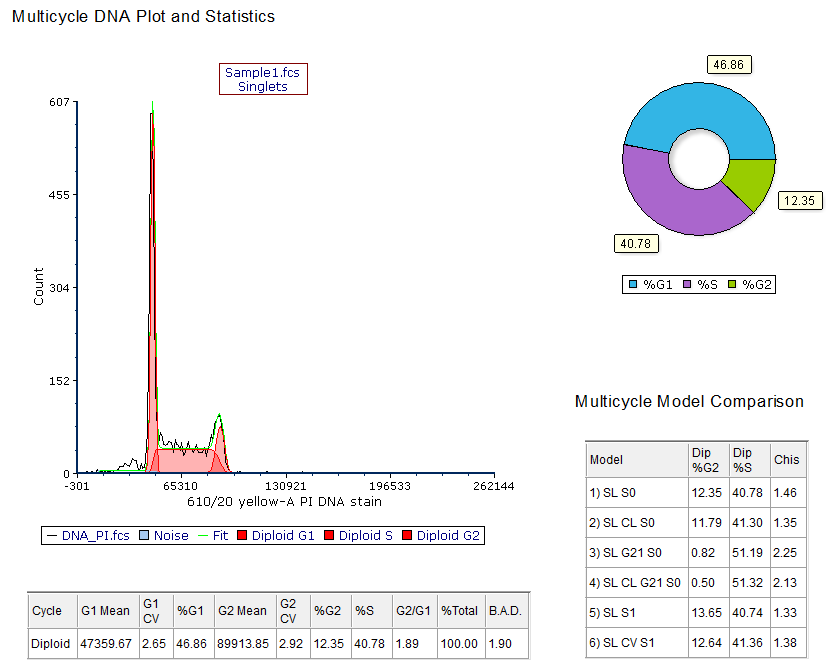
With minimal clicks, FCS Express will populate a scatter plot to help remove unwanted events then use a Multicycle plot to model your cell cycle phases automatically. This template then generates a pie chart using Integrated Spreadsheet. With a single click on the Run icon from the Batch & Export tab, batch processing will promptly export analysis report files for you. Further customize your reports, exports, and analysis as needed.
Using this template can help get you from your raw data to an analyzed report easily.
Download the DNA Cell Cycle Results with Multicycle Template
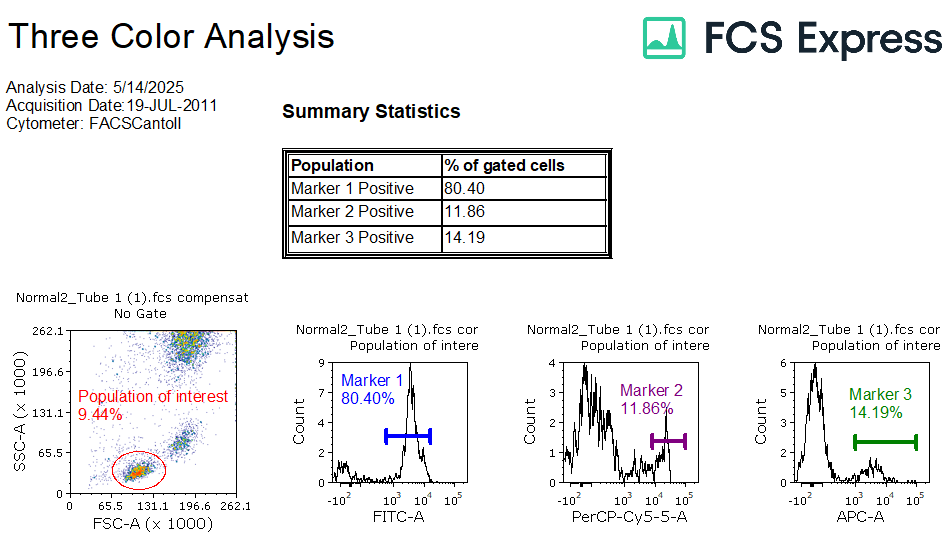
Help automate your Three Color Experiments with FCS Express.
The Three Color Experiment Template in FCS Express provides users with an easy to use analysis template to evaluate and report their experiment results. Open the layout and walk through the Startup Script to select the files, scatter parameters and the three colors of interest. After loading your data you can adjust or replace the gates as needed.
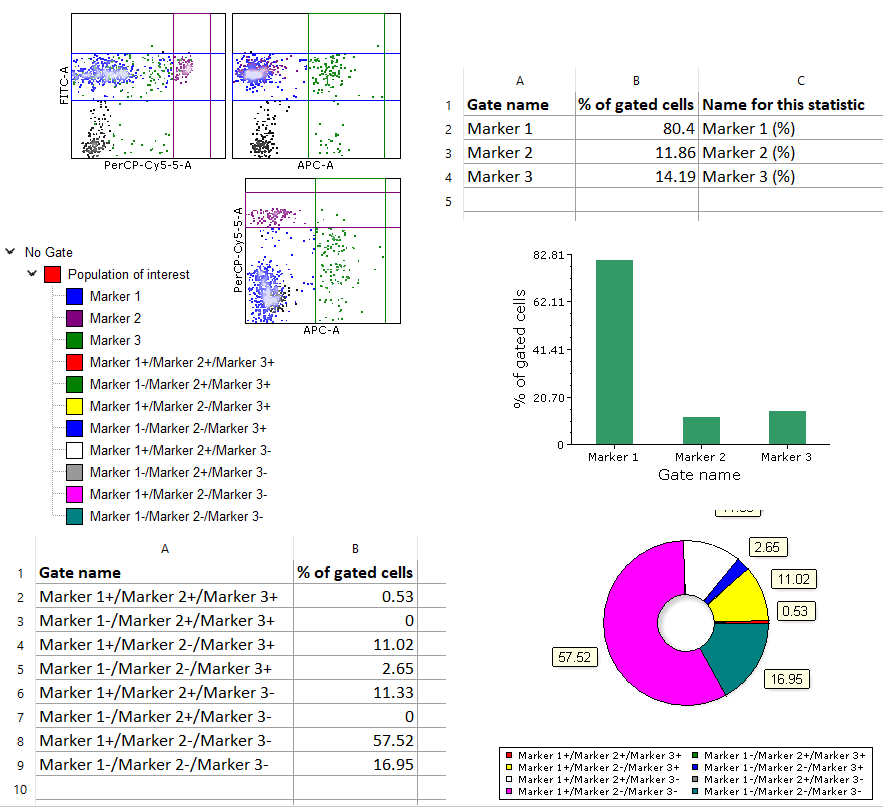
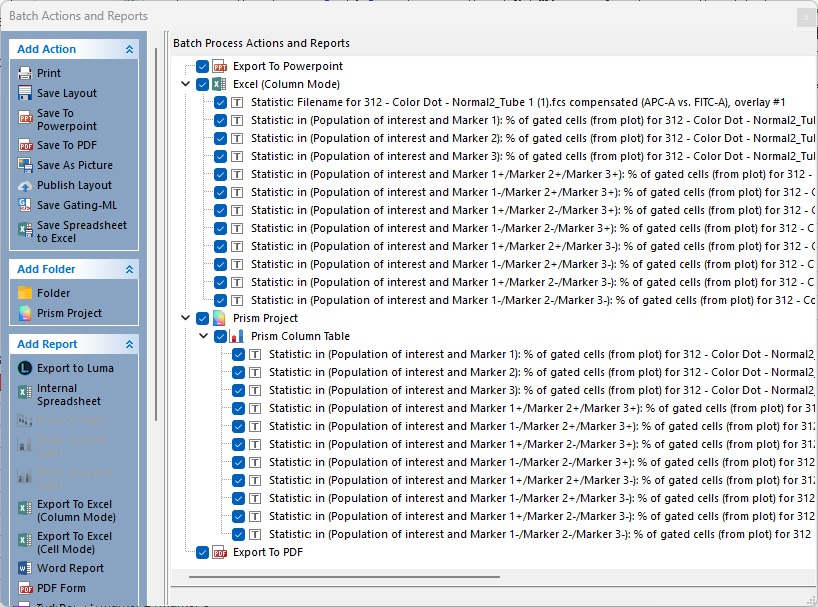
With minimal clicks, FCS Express will populate a scatter plot to help remove unwanted events then use histogram plots to select your positive populations. This automatically generates a bar chart and a pie chart using Integrated Spreadsheet. With a single click on the Run icon from the Batch & Export tab, batch processing will promptly export analysis report files for you. Further customize your reports, exports, and analysis as needed.
Using this template can help get you from your raw data to an analyzed report easily.
Download the Three Color Analysis Template
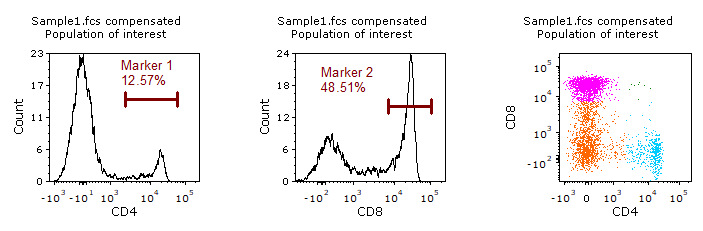
Help automate your Two Color Experiments with FCS Express
| The Two Color Experiment Template in FCS Express provides users with an easy to use analysis template to evaluate and report their experiment results. Open the layout and walk through the Startup Script to select the files, scatter parameters and the two colors of interest. After loading your data you can adjust or replace the gates as needed.
With minimal clicks, FCS Express will populate a scatter plot to help remove unwanted events then will use a second dot plot or histograms to select your positive populations. This automatically generates a bar chart and a pie chart using Integrated Spreadsheet. With a single click on the Run icon from the Batch tab, batch processing will promptly export analysis report files for you. Further customize your reports, exports, and analysis as needed. Using this template can help get you from your raw data to an analyzed report easily. |
 |
Templates are available here either with or without histograms:
Download the Two Color Analysis Template with Histograms
This template uses a 1D Histogram to gate each color separately.
Download the Two Color Analysis Template with Dot Plots
This template uses a 2D Dot Plot to gate both colors on the same plot.
If you have any feedback on the above templates, we’d love to hear from you. Which one did you use or prefer? What other templates do you think would be useful for FCS Express. Contact support to let us know!
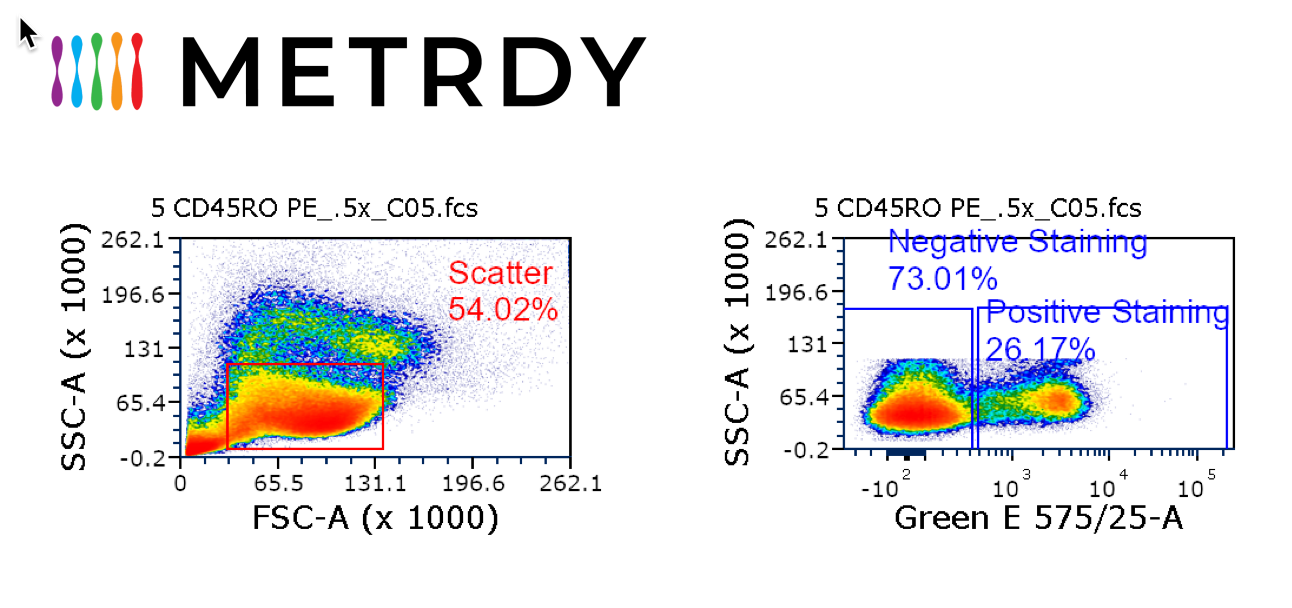
 The Universal Antibody Titration template in FCS Express provides users with an easy-to-use analysis template to evaluate and assess antibody titrations.
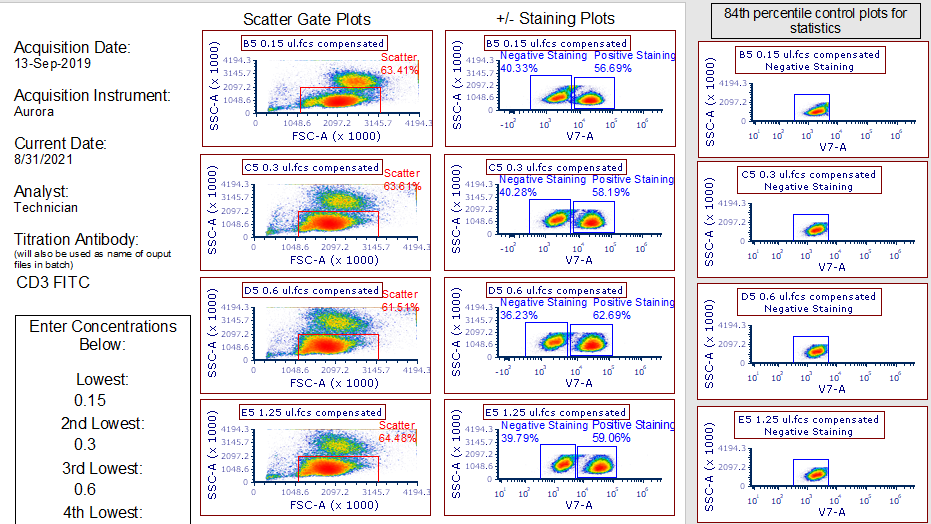
Open the layout and walk through the Startup Script or follow the instructions provided within the layout Standard Operating Procedures.
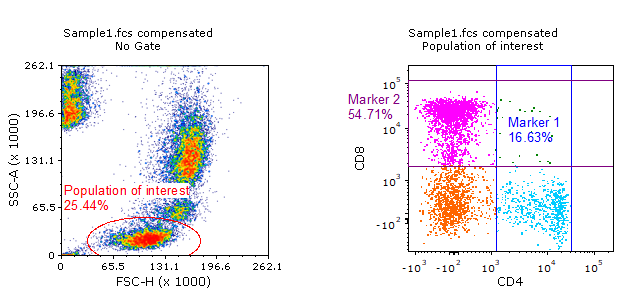
After loading your titration data, adjust parameters, and modify or replace the scatter, negative staining, and positive staining gates as needed. Enter Titration Antibody and Concentration information and FCS Express will automatically name your batch processing output/report files and populate your spreadsheet for your regression plots.
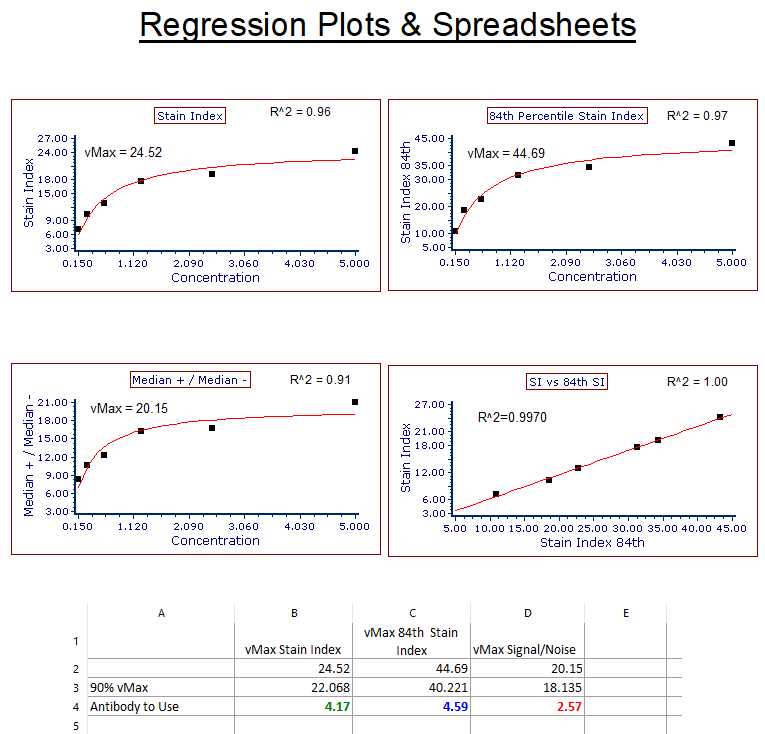
With a few user actions, the Universal Antibody Titration Layout auto-generates the following regression plots:
The optimal antibody concentration to use is auto-calculated by FCS Express in a spreadsheet using 90% of the vMax from the Stain Index, Separation Index, and signal-to-noise ratio regression plots.
A second spreadsheet contains all the essential antibody titration statistics and is ready for export. With a single click on the Run icon from the Batch tab, batch processing will promptly export your titration report files.
A zip file is available for the template that you need. Within the zip file you will find:
Note - the titration templates below are only compatible with FCS Express v7.20.0023 or higher. If you are running an older version of FCS Express, please contact support@denovosoftware.com to request a previous version of the templates.
After downloading the zip file, please follow the appropriate instructions below to keep the relative pathway of files intact according to the operating system that you use.
We have made these templates available to be used as-is. Any modifications are done at the user's discretion. Questions about the use of these templates can be directed to support@denovosoftware.com.


The webinar Performing Titration in FCS Express can be viewed below or at https://youtu.be/hcpT0oQvoY0.
View the full PDF instructions for step-by-step guidance on how to use the Universal Antibody Titration Template.


Metrdy is a database of antibody titrations, harmonized by dilution factor and concentration to allow for direct comparison of supplier, clone, fluorophore, and cost per sample.
Metrdy aggregates titration data from numerous peer-reviewed publications and harmonizes the units to "# of tests at optimal titration", allowing direct comparisons between supplier’s clones, and conjugates.
You can see curated data and user contributions to make the most informed purchasing decisions. Importantly, you can contribute your own antibody titration data to the Metrdy repository as a publication linked to your ORCID. Metrdy is a registered publisher with Crossref.
FCS Express has teamed up with Metrdy to provide an easy-to-use analysis template that allows you to evaluate and assess titration data and provide the results in the right format for direct upload to the Metrdy repository.
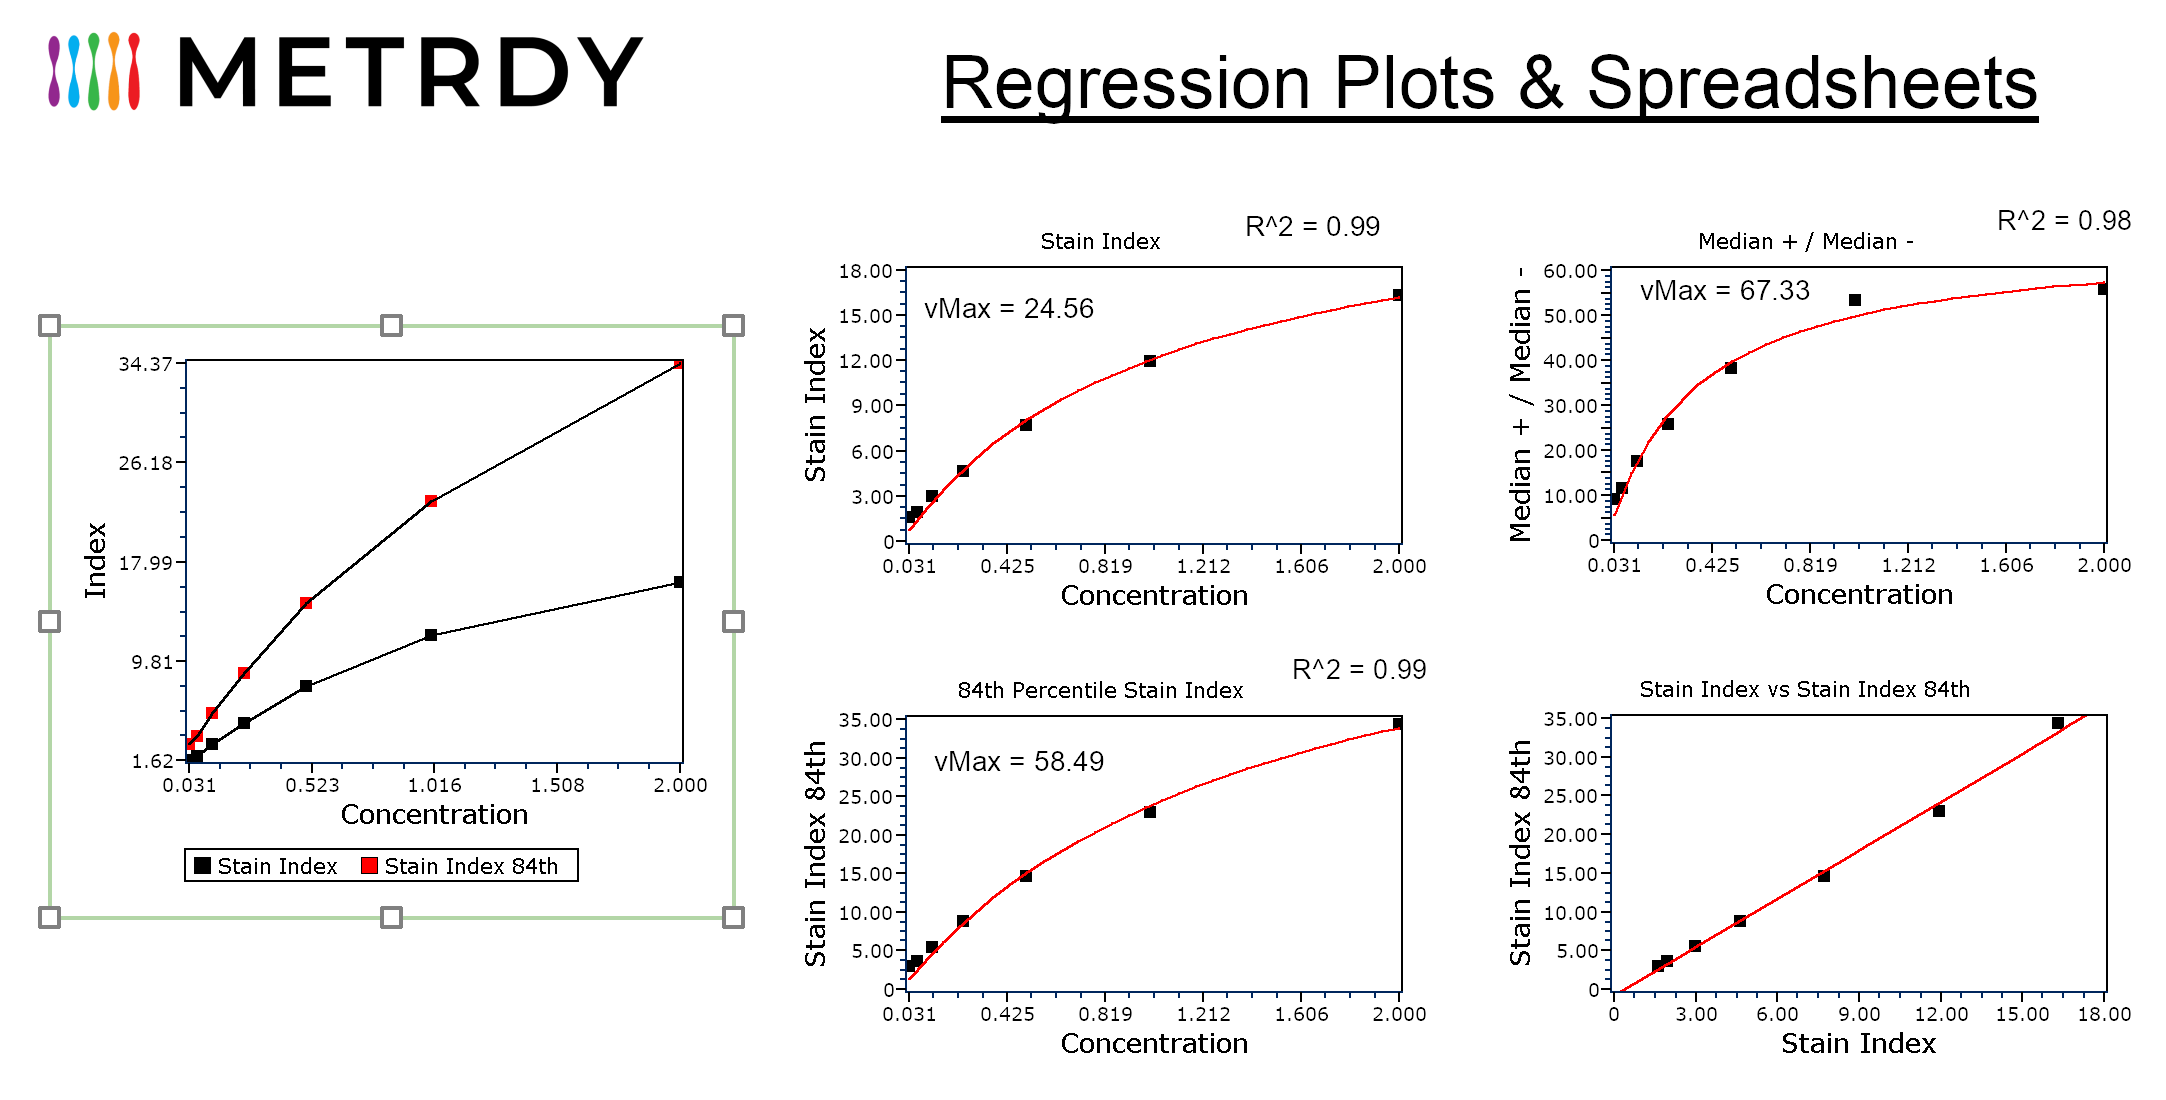
After opening the layout, the start-up script walks you through loading your data and selecting the parameters of interest. With a few user actions (entry of metadata into tables and adjustment of sample gates) the layout will automatically generate regression plots and calculate the Stain Index and the 84th percentile Separation Index.
The optimal antibody concentration to use is auto-calculated by FCS Express in a spreadsheet using 90% of the vMax from the Stain Index, Separation Index, and signal-to-noise ratio regression plots.
With a single click on the Run icon from the Batch tab, batch processing will promptly export your titration report files, including an excel report containing all the information needed for direct upload to the Metrdy repository.
| Two zip files are available for download:
The Metrdy Template Completed Example contains a completed example layout and the template excel file required for generating the Metrdy upload excel. The Metrdy Template (unlinked) contains a blank layout and the template excel file. The start-up script will lead you through loading your files and setting up the parameters step-by-step. You can then enter specific information into the relevant tables and adjust the gates to allow the layout to automatically calculate the optimal titre of antibody. Clicking Run from the Batch tab will generate ppt and pdf reports as well as an excel spreadsheet that you can then upload to Metrdy. |
|
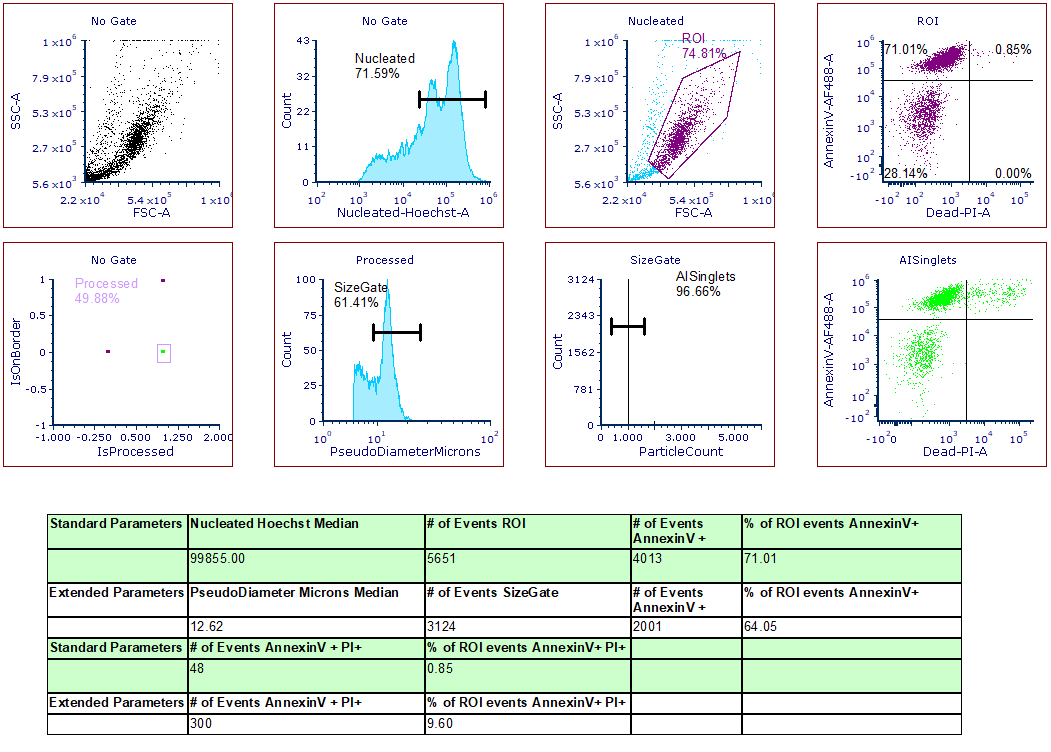
| The award-winning Invitrogen Attune CytPix Flow Cytometer combines acoustic focusing with a high-speed brightfield camera for simultaneous high throughput flow cytometry and high resolution brightfield imaging. De Novo Software has continued to collaborate with the Thermo Scientific to support both .FCS file and .ACS file exports from the CytPix so FCS Express users can continue to move from raw data to results while maintaining access to images and linking between images, plots, gates, and statistics. | 
|
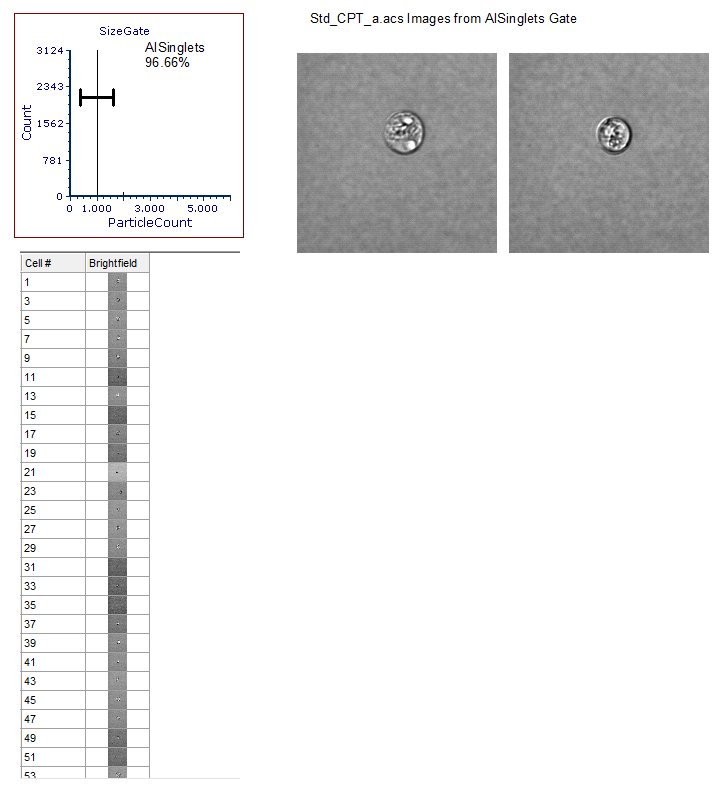
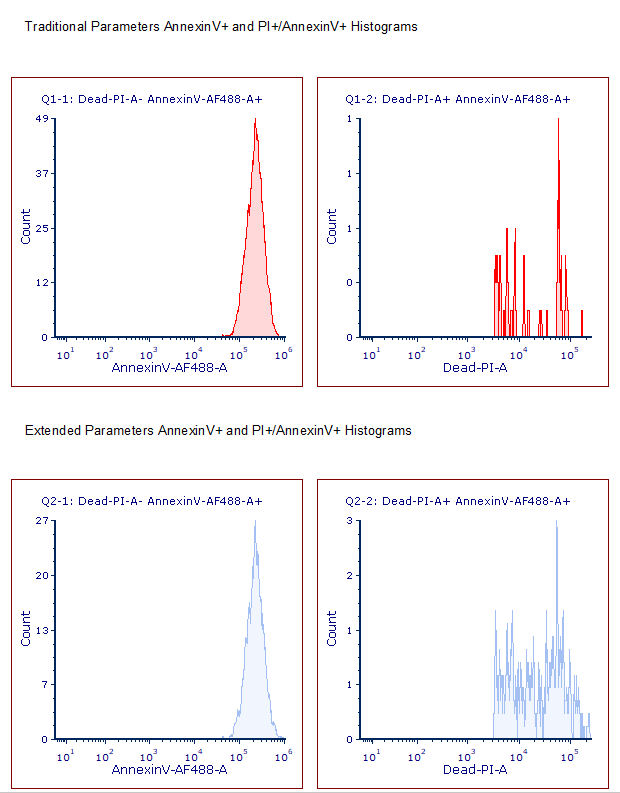
The apoptosis analysis example below outlines an approach to evaluating and assessing apoptosis while working with data from the CytPix, including images. In the example layout, users will find the ability to confirm gating strategies by reviewing images via Data Grids as well as displaying representative images of populations as part of the analysis strategy. The analysis example incorporates a comparison of extended parameters created from the Attune Cytometric Software which have the capability to provide data to confirm singlets with cell count (Particle Count) and morphology features such as roundness (Circularity), size (Area Square), shape (Eccentricity) and complexity (Entropy) to standard parameters. Using image analysis features created by Attune Cytometric software for morphometric parameters like the particle count allows users to quickly and accurately identify populations of interest and confirm gating strategies.
View example images below or download the example layout generated from an Attune CytPix dataset.
 The BD® Cytometric Bead Array (CBA) measures a variety of soluble and intracellular proteins, including cytokines, chemokines, growth factors, and phosphorylated signaling proteins using flow cytometry.
FCS Express can help you create an innovative method to help you analyze your CBA data consistently.
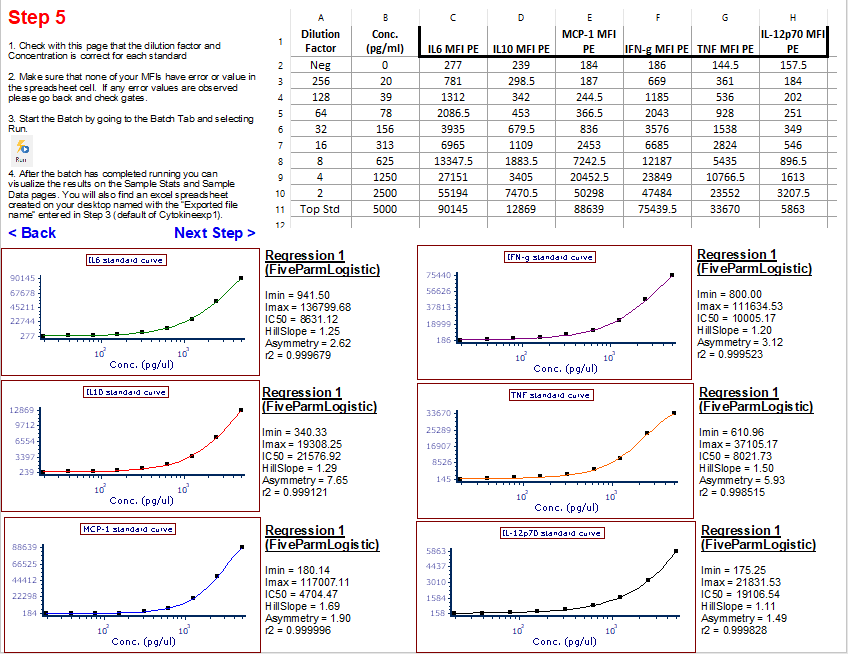
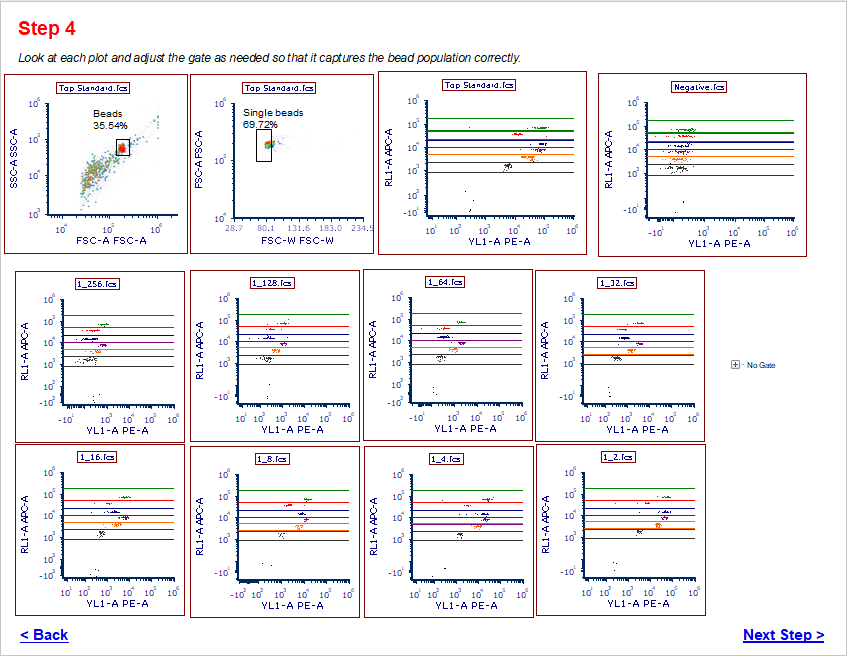
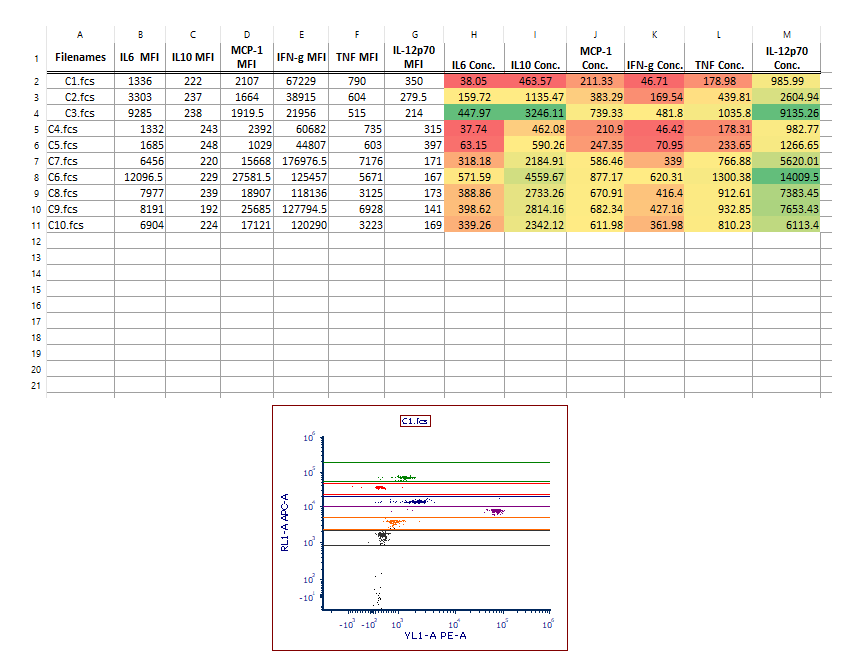
The example below displays how FCS Express can be used to help you analyze a standard cytometric bead array kit that contains a fixed number of 6 analytes. FCS Express can provide you with a way to conveniently upload your standard and sample files to easily be able to get unknown concentrations and a bar chart visualization for each analyte.
You can download a layout with pre-loaded data to get a better idea of how this concept will work.
Download the FCS Express CBA 6 Cytokine layout as an example layout with pre-loaded data.


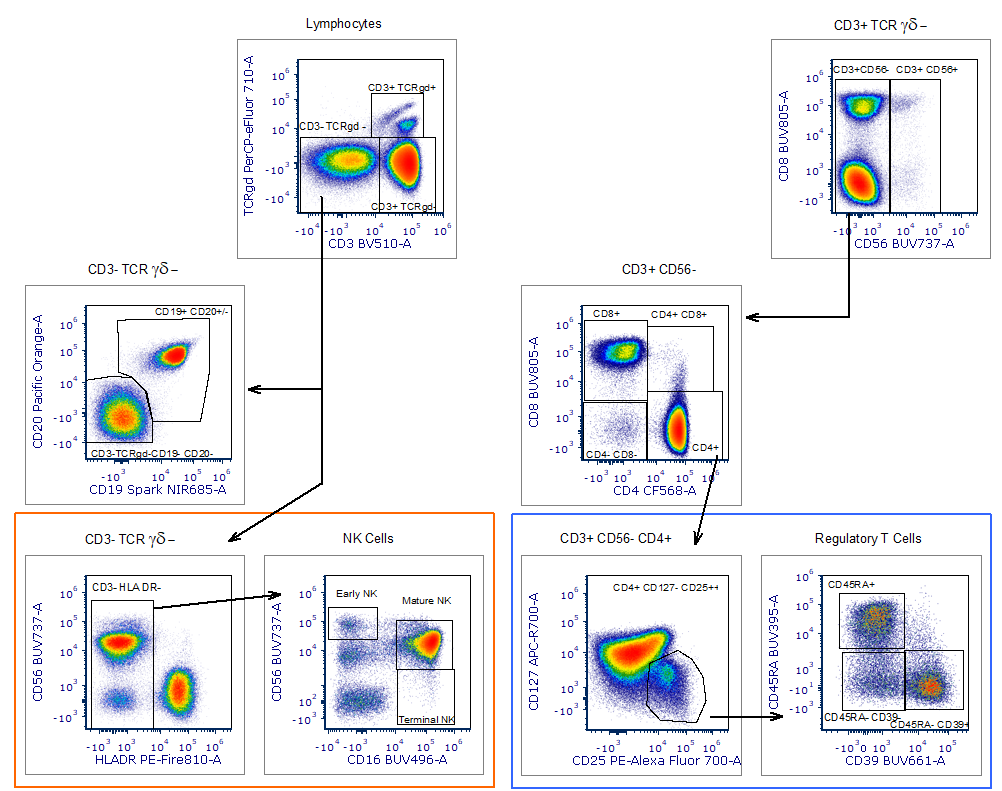
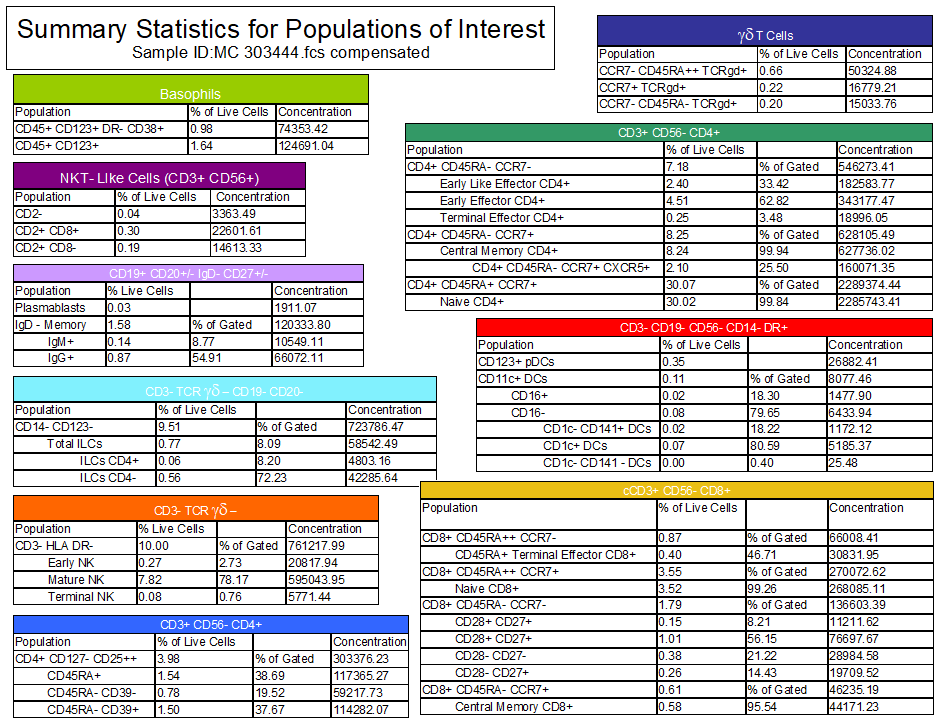
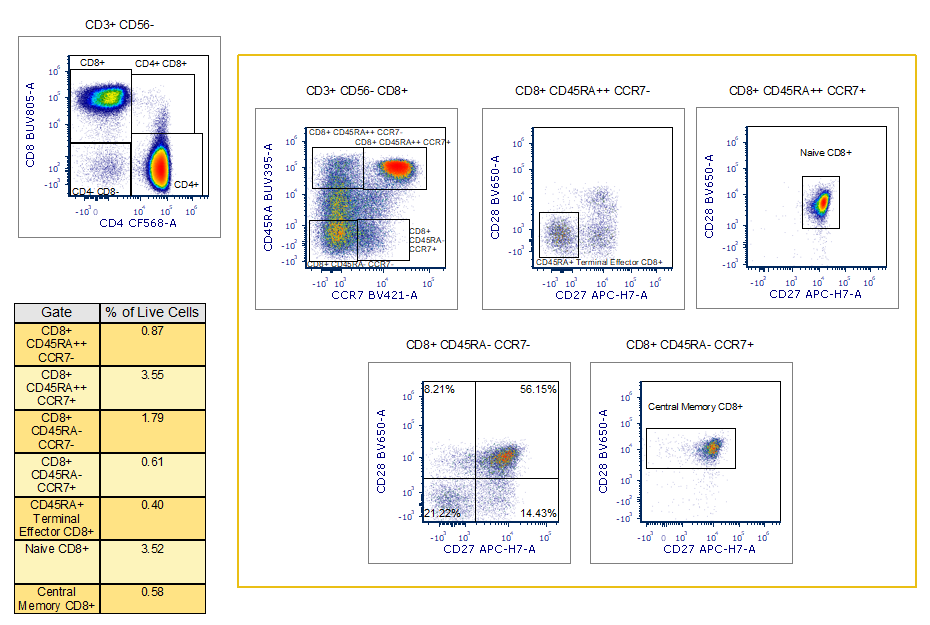
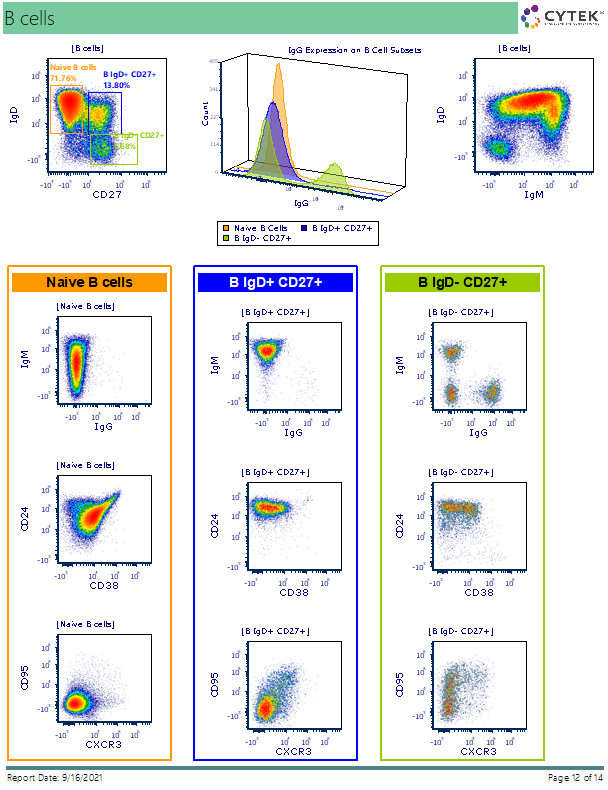
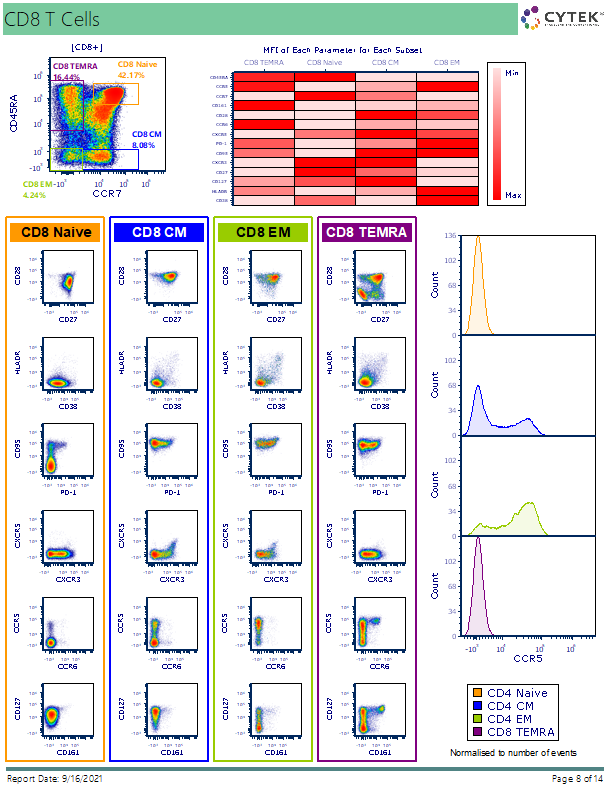
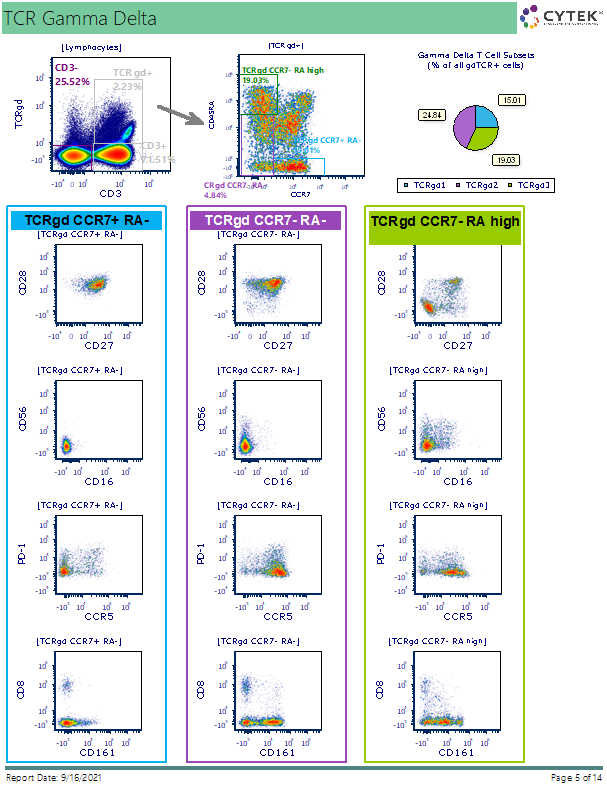
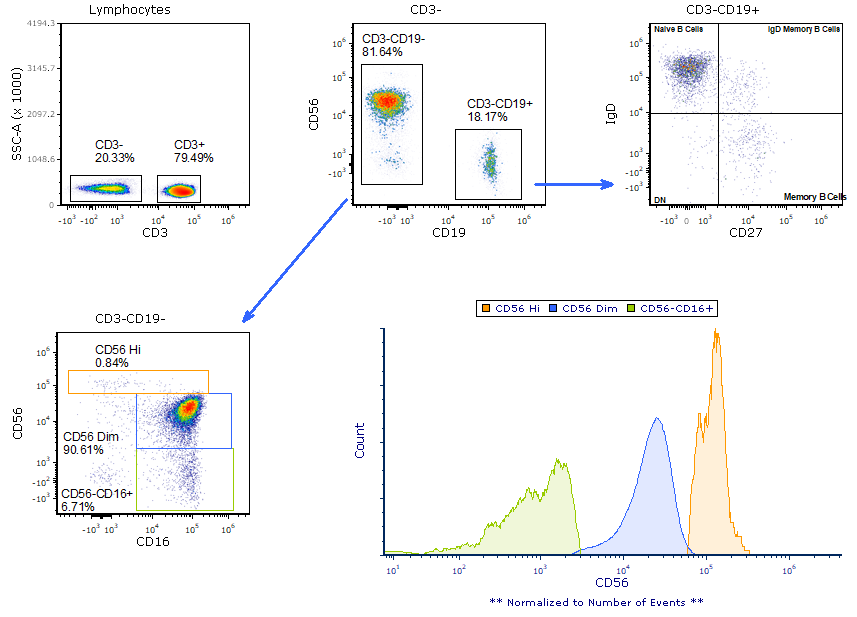
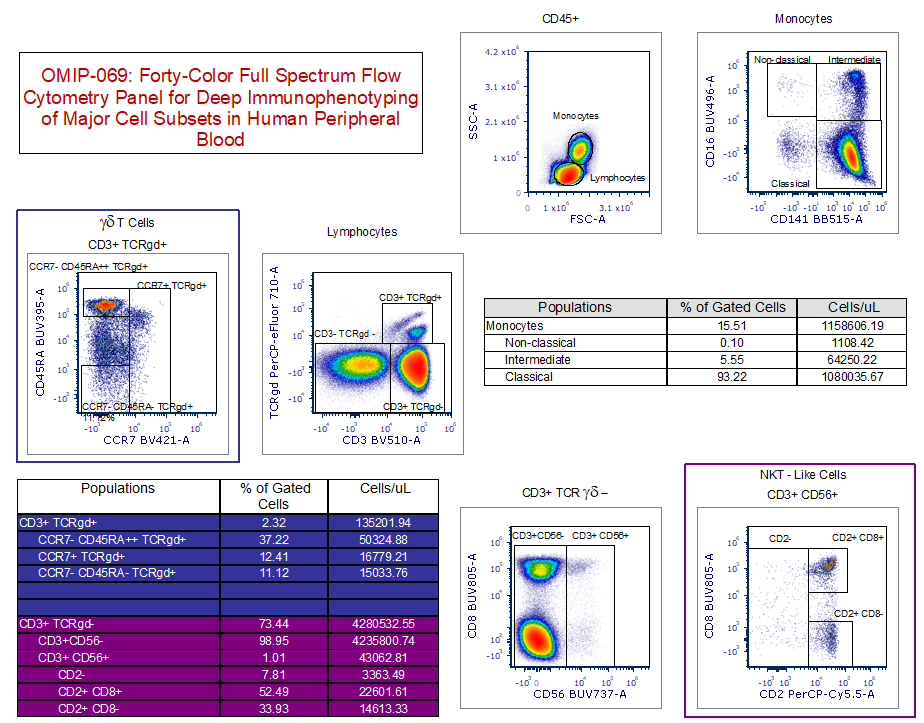 OMIP-069 is a 40-color flow cytometry-based panel developed by Cytek for in-depth immunophenotyping of the major cell subsets present in human peripheral blood. The panel presented here identifies CD4 T cells, CD8 T cells, regulatory T cells, γδ T cells, NKT-like cells, B cells, NK cells, monocytes and dendritic cells. For each specific cell type, the panel includes markers for further characterization by including a selection of activation and differentiation markers, as well as chemokine receptors. The panel can be used for studies aimed at characterizing the immune response in the context of infectious or autoimmune diseases, monitoring cancer patients on immuno- or chemotherapy, and discovery of unique and targetable biomarkers.
The FCS Express layout provides users with a foundation for data analysis using an optimized panel. You have the ability to customize this OMIP -069 layout to meet your specific analysis needs. Save your customized template and with each new data set you will move quickly and easily from analysis to results.
All the initial gates, plots, and visualizations will automatically populate, after opening the layout and loading your new data files into the data list. Make any adjustments as needed and then click on Run in Batch Processing to generate your desired automatic exports (PDFs, PowerPoint, Excel, etc) to your desktop. Make your analysis reliable, reproducible, and straightforward!
Download the FCS Express OMIP-069 layout template
OR
Download the FCS Express OMIP-069 layout as an example layout with pre-loaded data.


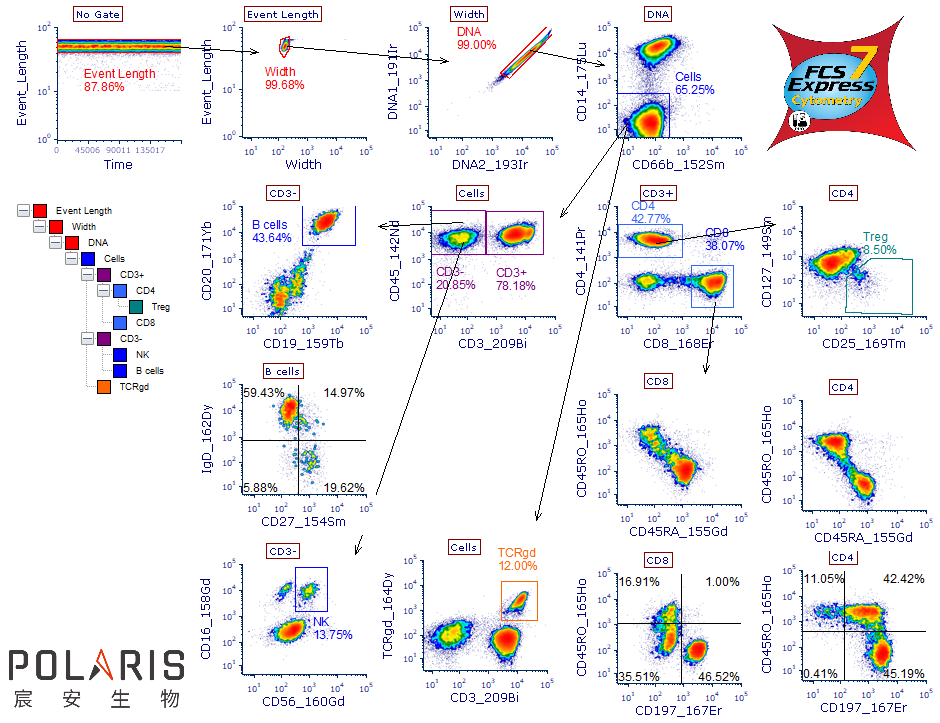
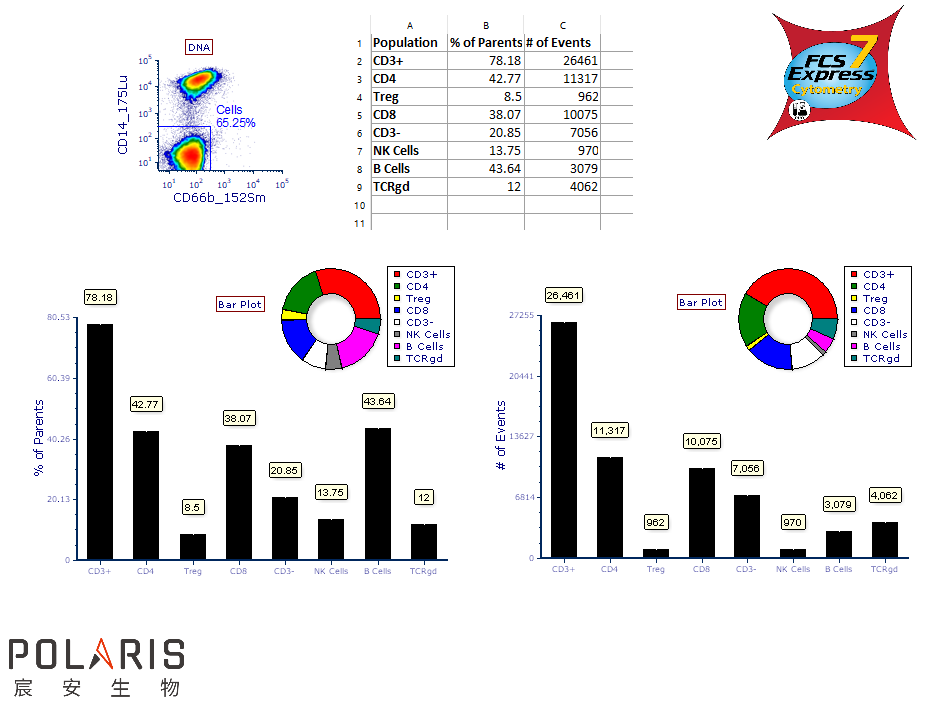
Polaris Biology, a leading innovator in single-cell technologies, has developed the Polaris Biology Starion™ Mass Cytometer instrument. The Starion combines high-throughput power and accelerated test speeds to achieve high resolution results.
The resultant data files can then be imported into FCS Express for a seamless transition between acquisition and analysis. Scientists can move beyond creating standard plots and incorporate transformations like t-SNE, UMAP, and FlowSOM to optimize extracting additional information about how markers are interacting within a given data set. With access to advanced statistics, charting tools, and reusable templates FCS Express makes analysis of your Starion data straightforward. While you are creating your analysis strategy you are generating your reliable, reproducible, and reportable results.
The FCS Express layout below provides users with a foundation for data analysis using the Human Lymphocyte Immunophenotyping Kit from Polaris Biology. You have the ability to customize the layout to meet your analysis requirements. Save your newly customized template and with each new data set you will move quickly and easily from analysis to results.
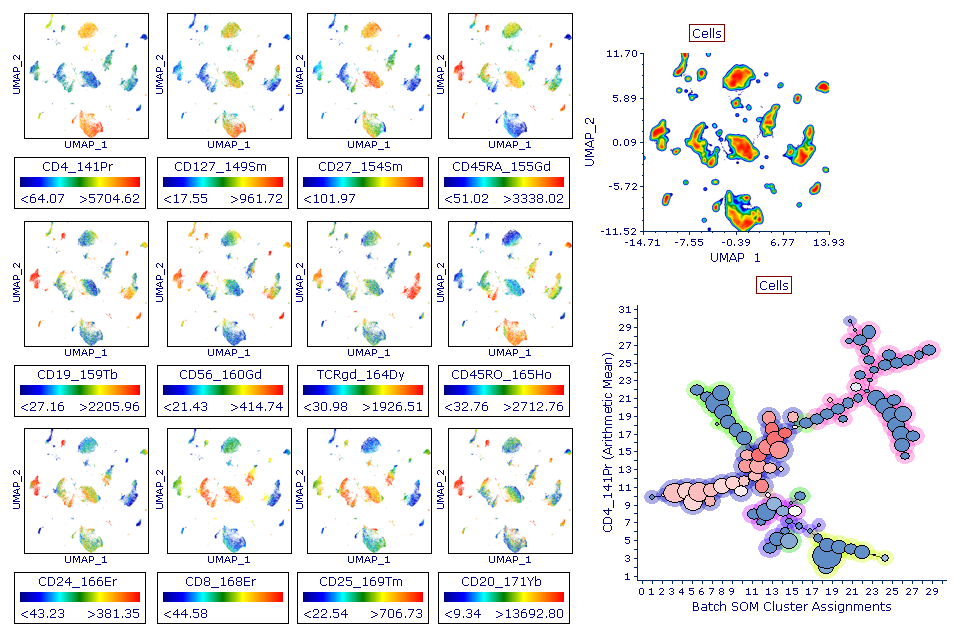
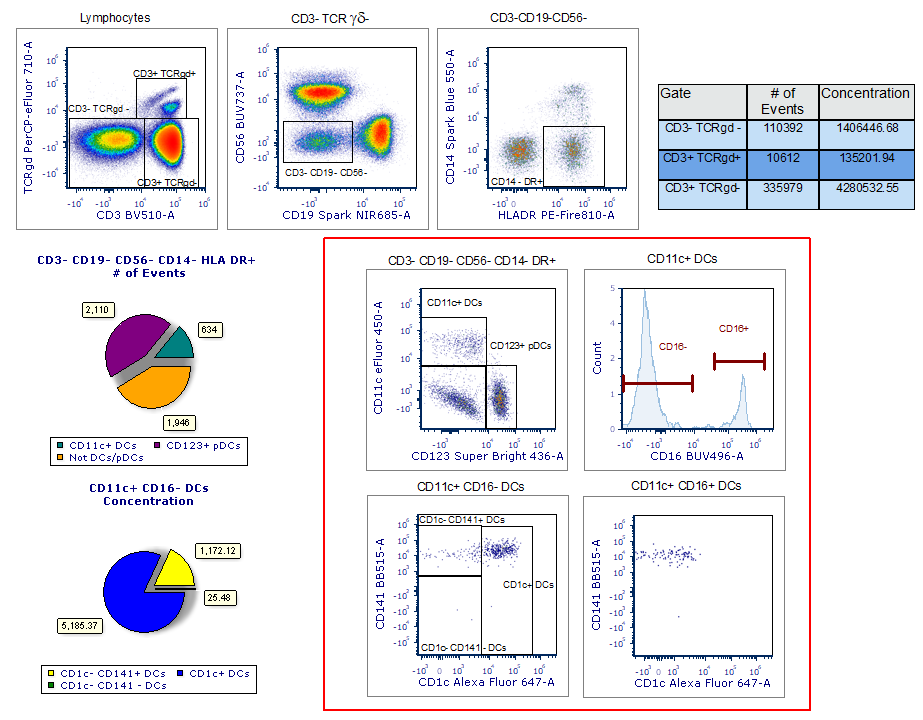
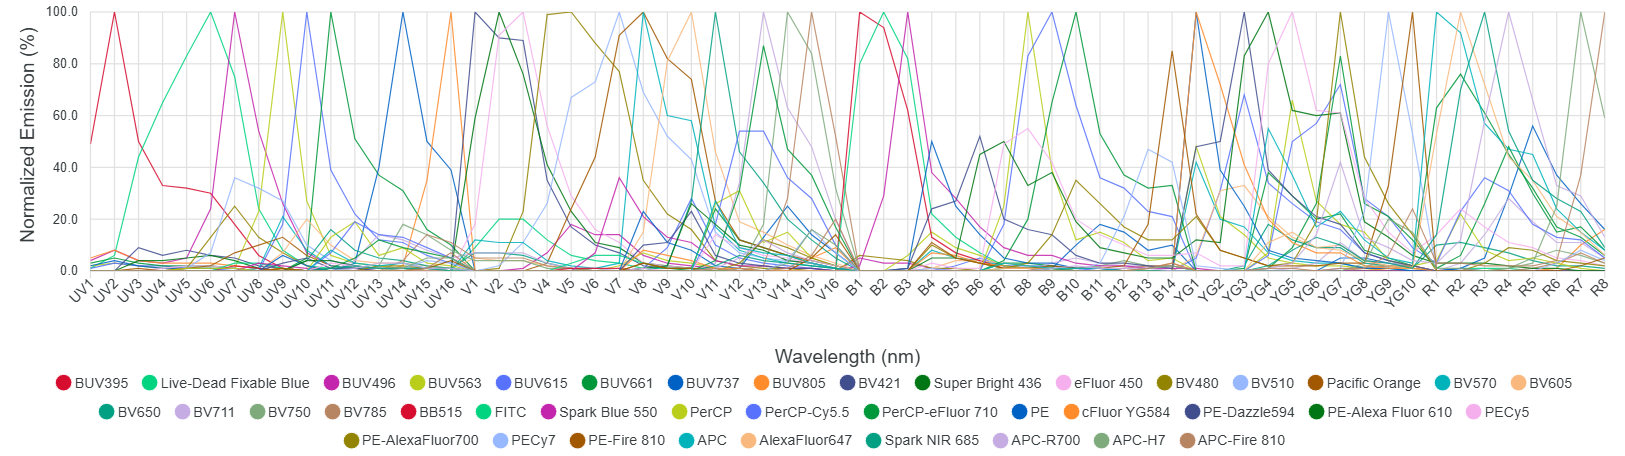
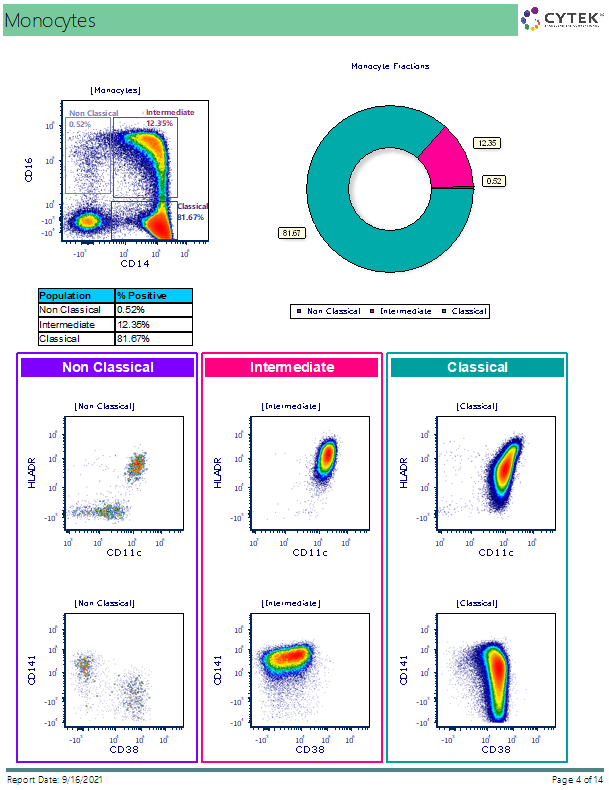
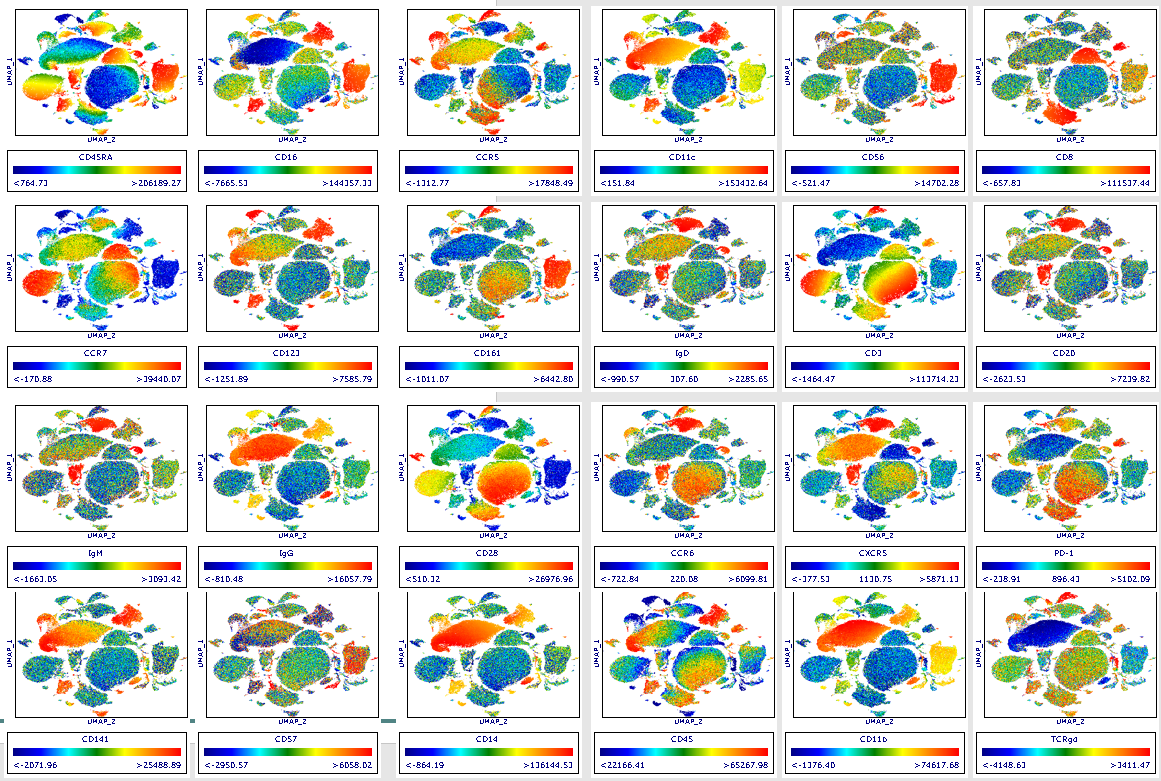
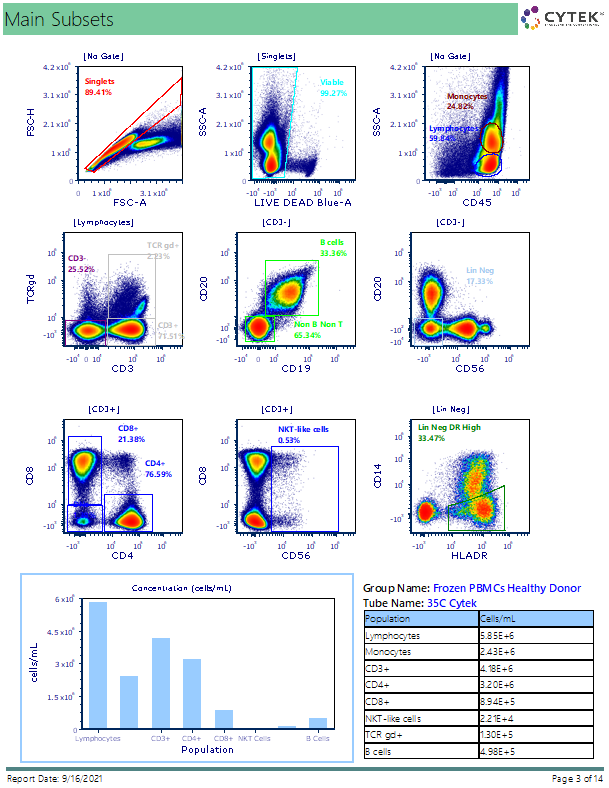 Cytek is an innovative leader in research and is committed to developing cytometry strategies that advance the scientific community. By applying panel design principles, a 35 color Immunophenotyping panel to investigate COVID-19 Immune response was designed using the Cytek Aurora. The teams at Cytek and De Novo Software have constructed an analysis layout to complement the COVID-19: 35 Color Immunophentoyping panel. The analysis layout identifies key populations of the immune system: Monocytes, TCR Gamma Delta T Cells, CD4 T Cells, T Regs, CD8 T Cells, CD4 – CD8- T Cells, NKT-Like Cells, NK Cells, B Cells, and Dendritic Cells.
The layout brings analysis beyond traditional gating and allows for new biological knowledge to be extracted from single-cell data by integrated pipelines and uMap. The use of high dimensional analysis tools found in FCS Express allows users to quickly visualize variables for further data exploration. The inclusion of charting features in the layout helps with the process of identifying differences in expression of immune cells between healthy and unhealthy samples for the user. The COVID-19: 35 Color Immunophenotyping panel makes Identifying populations of interest and extracting important variances streamlined and simple.

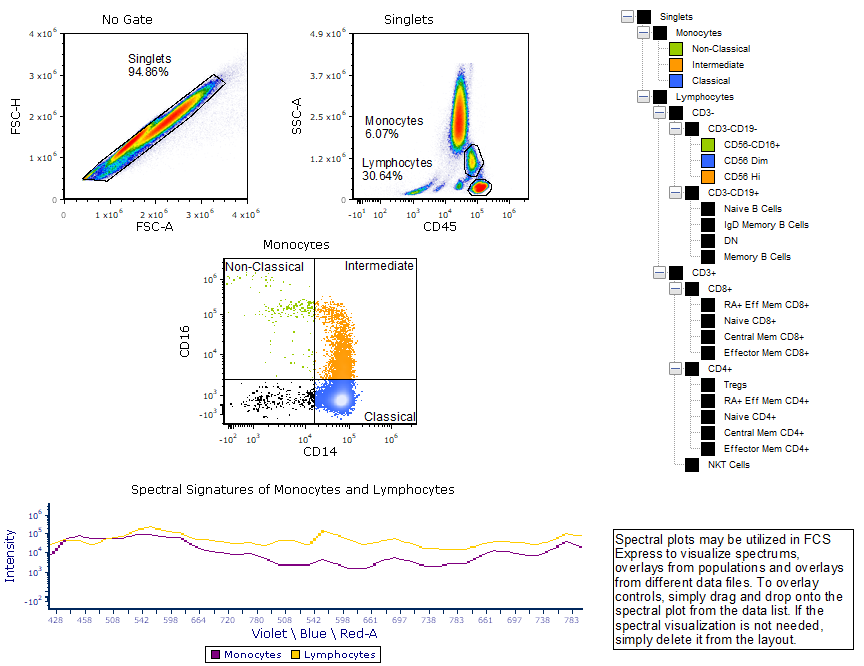
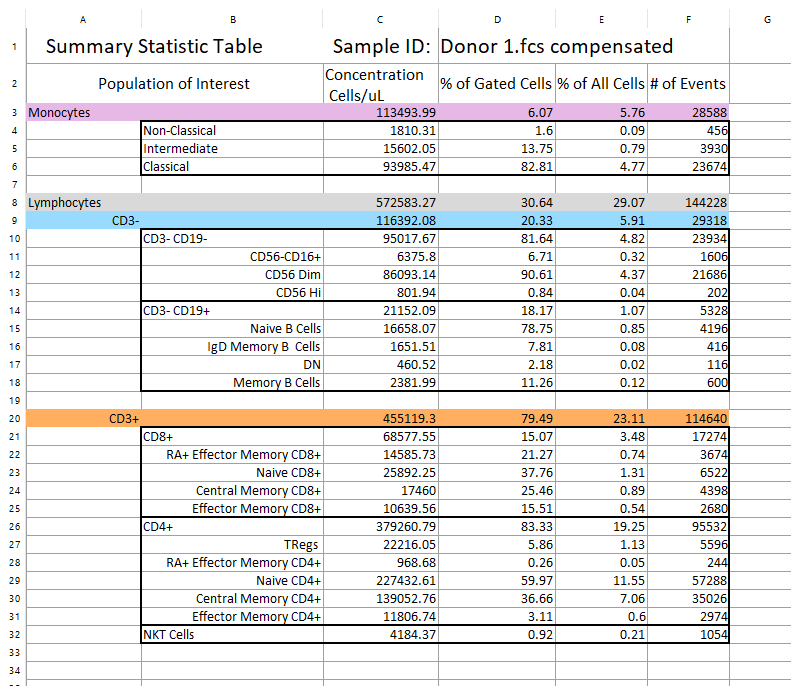
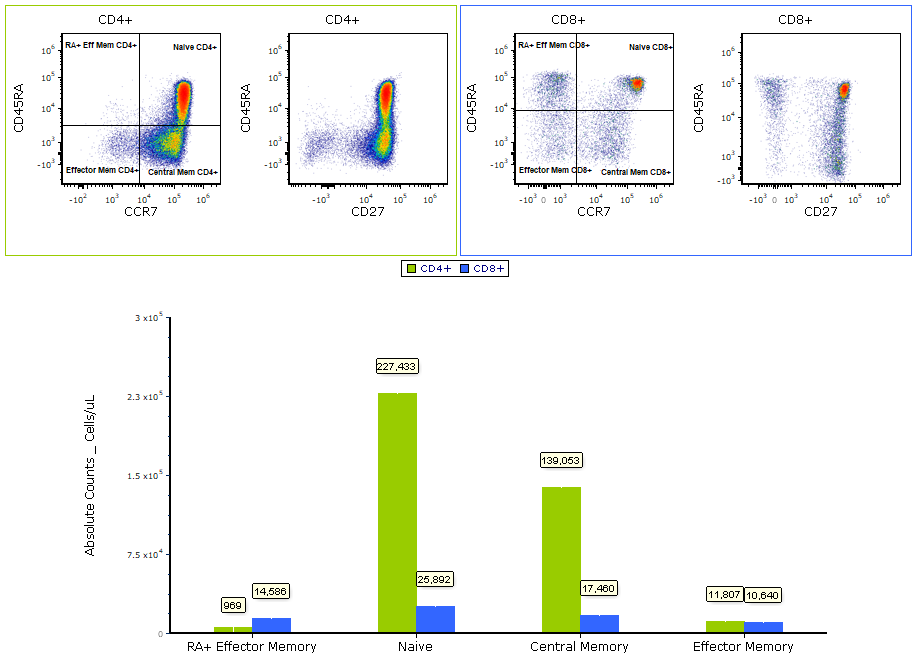
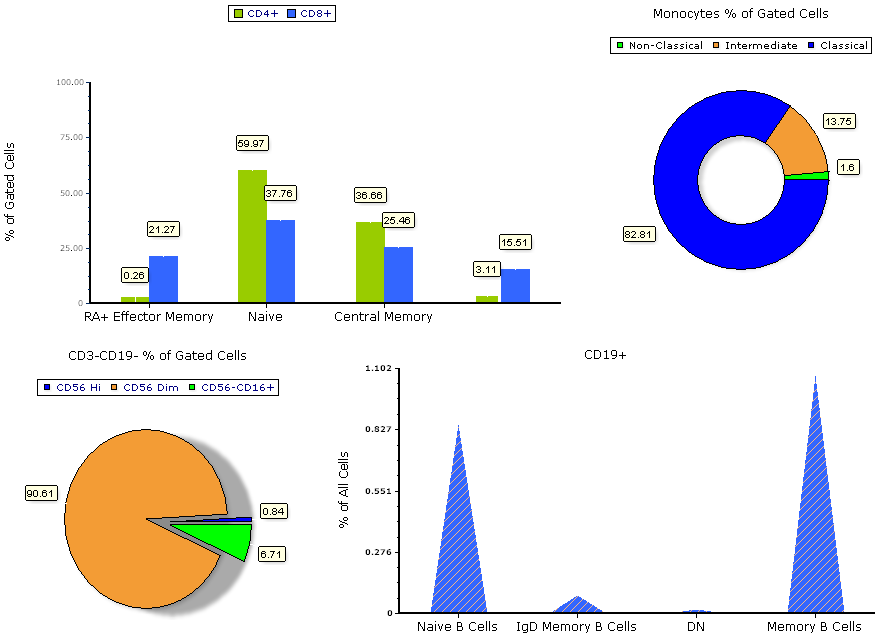
 The Cytek cFluor™ Immunoprofiling Kit allows for the identification of helper T cells, cytotoxic T cells, B cells, NK cells and monocytes in human peripheral blood mononuclear cells and in whole blood. The reagents in this kit help to distinguish different subsets of T, B and NK cells; including regulatory T cells, naïve T cells, activated T cells, memory T cells, effector T cells, naïve B cell, memory B cells, nonclassical and classical monocytes.
The FCS Express 14C layout provides users with a turn key solution for data analysis of data acquired for the Immunoprofiling kit. Simply open the layout, load your data into the data list, and initial gates, plots, and visualizations will automatically populate awaiting your final analysis changes. Once complete, click on Run in the batch actions for automatic exports to your desktop. What could be easier!
Download the FCS Express 14C cFlour Immunoprofiling Kit layout template
OR
Download the layout as an example layout with pre-loaded data.


| View the Cytek 14C panel in EasyPanel |
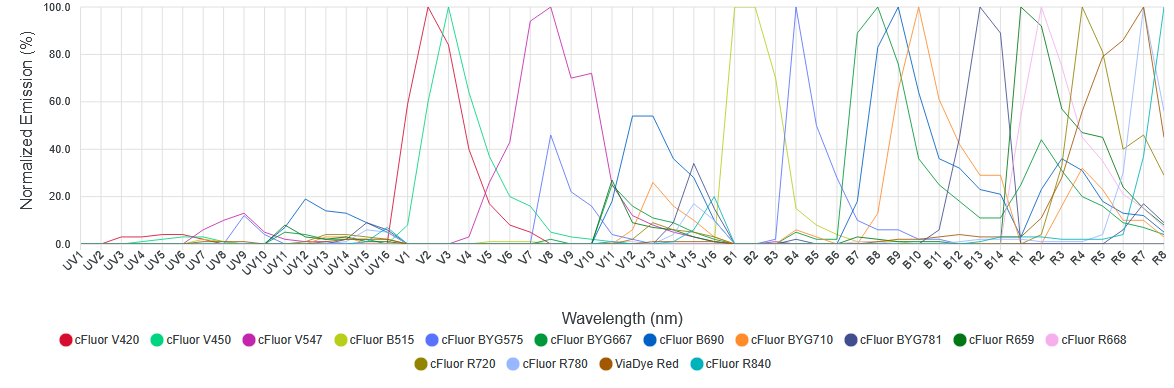
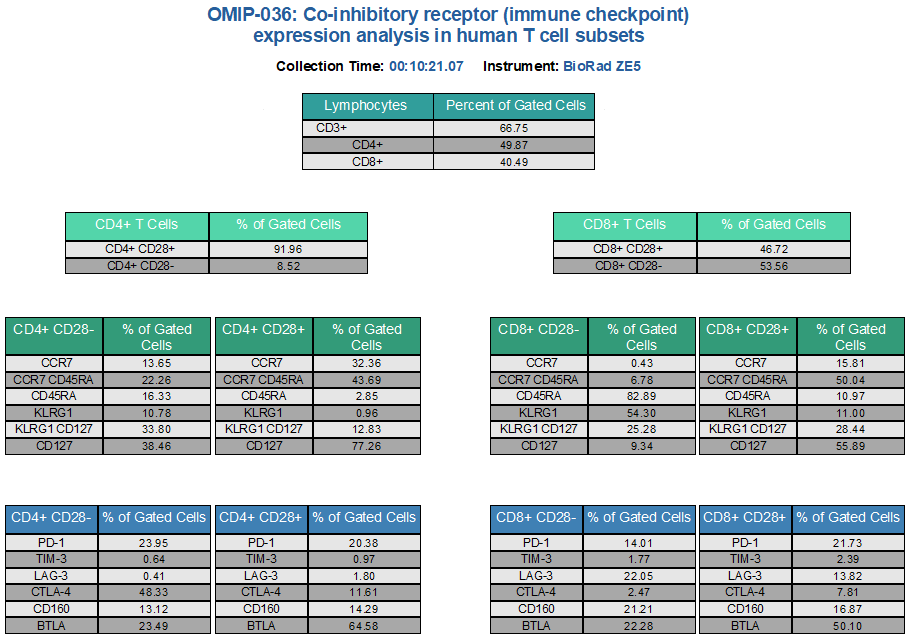
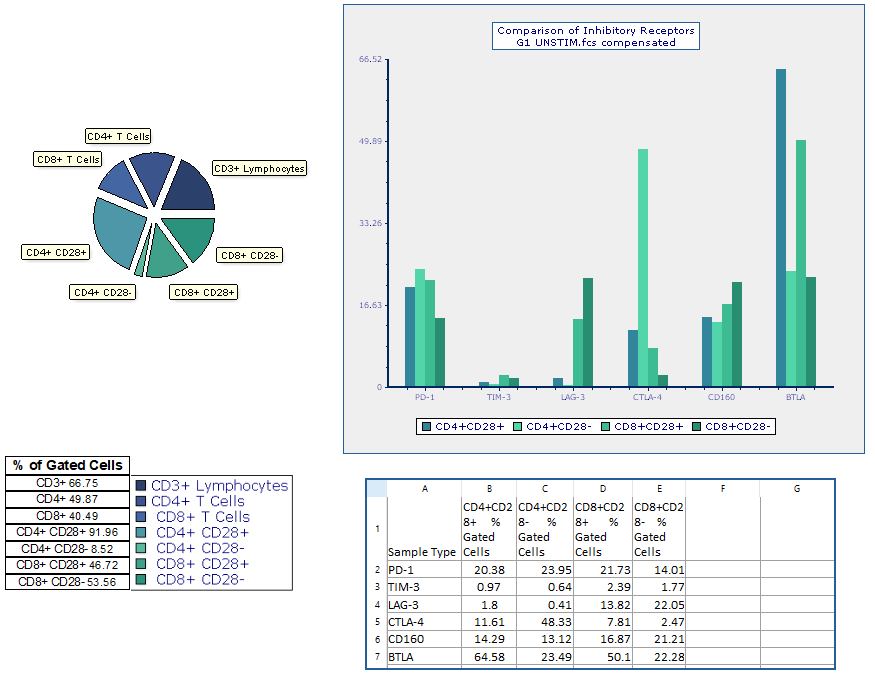
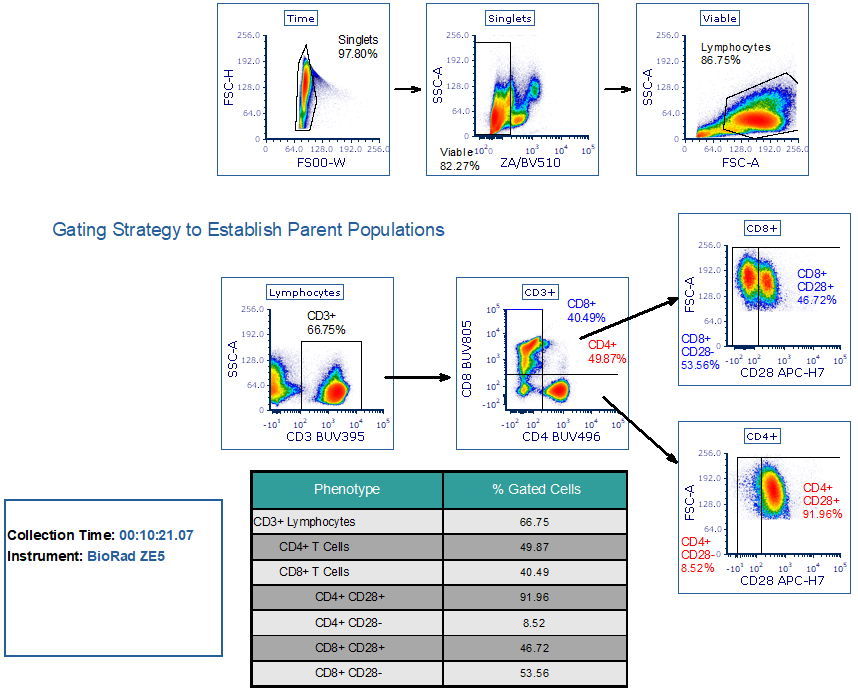 Optimized Multicolor Immunofluorescence Panels (OMIPs) are peer-reviewed panels designed for fluorescent assays. In the example below OMIP-36 was performed on a BioRad ZE5 instrument with analysis, compensation, reporting, and experiment summaries created in FCS Express.
Download the full FCS Express layout template and sample data for OMIP-36 used in the examples below to explore the sample data or use as a template for your own results. If you do not yet own FCS Express open the published layout with the free FCS Express Reader to explore the data and see what FCS Express can do for your analysis.
OMIP-36 is originally published by Healy ZR, Murdoch DM. OMIP-036: Co-inhibitory receptor (immune checkpoint) expression analysis in human T cell subsets. Cytometry A 2016; 89: 889– 892. The FCS Express layouts provided have no affiliation with the original publishers and are intended as a guide for researchers utilizing OMIP-36 with BioRad ZE5 instruments and FCS Express with a similar configuration.
Learn more about the reagents used in OMIP-36 on the FluoroFinder website.

| View the OMIP-036 panel in EasyPanel |
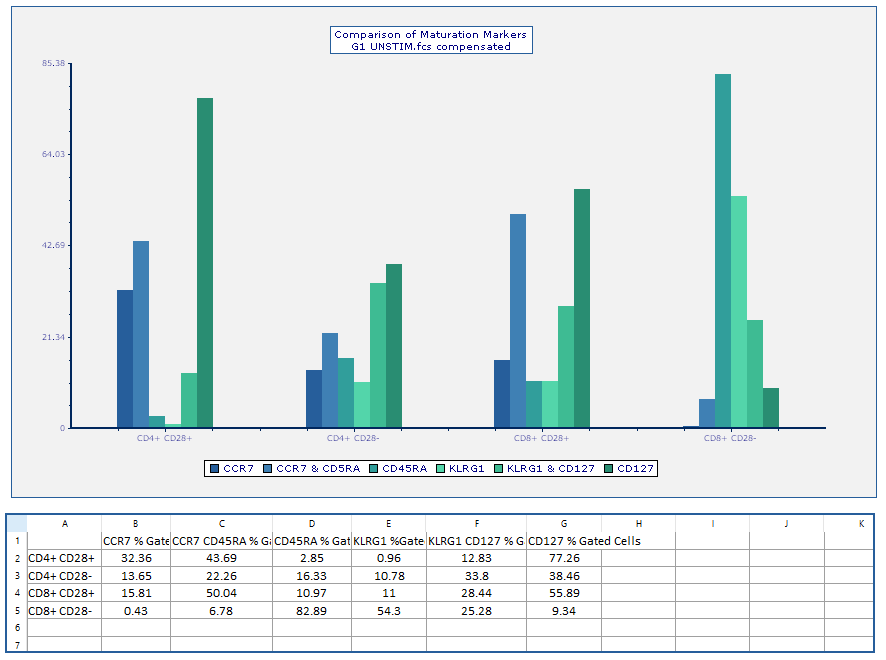
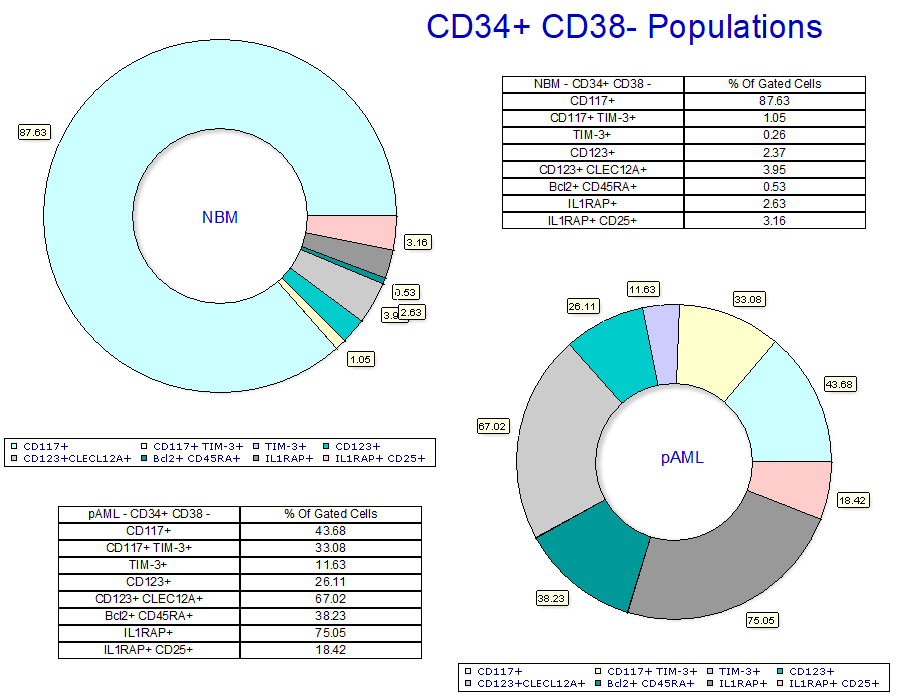
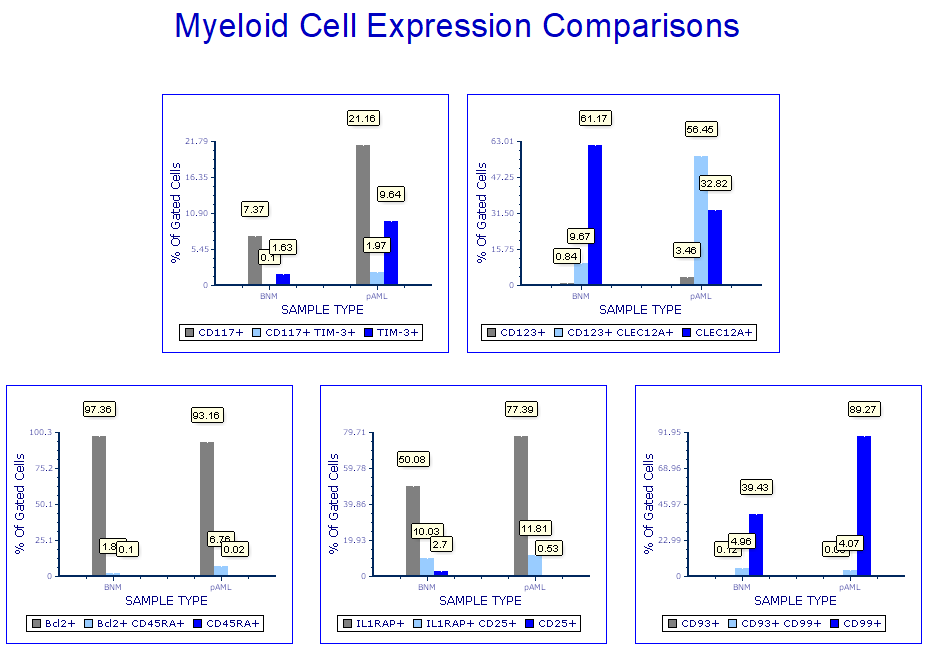
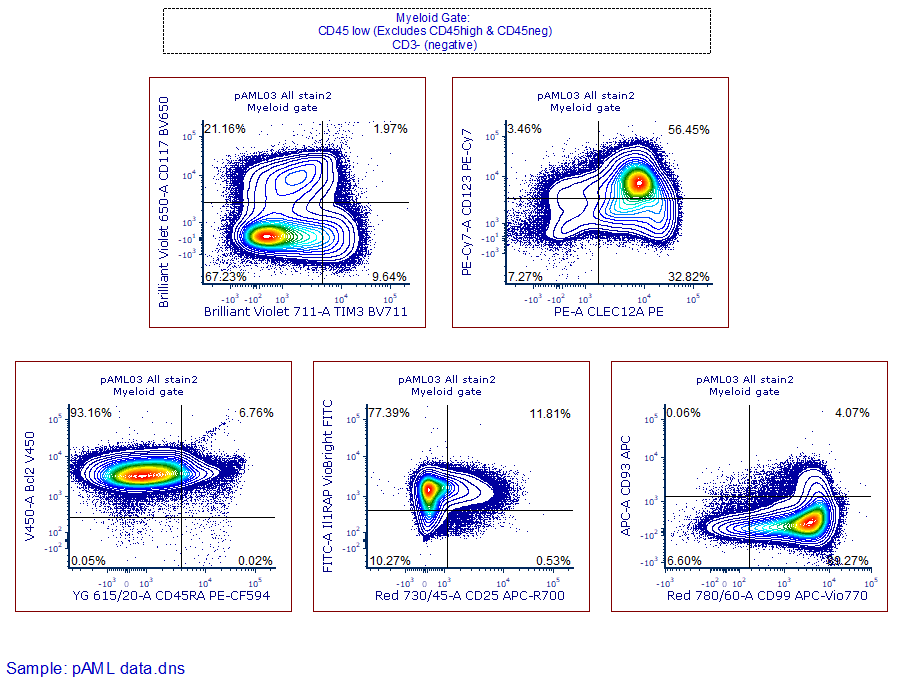
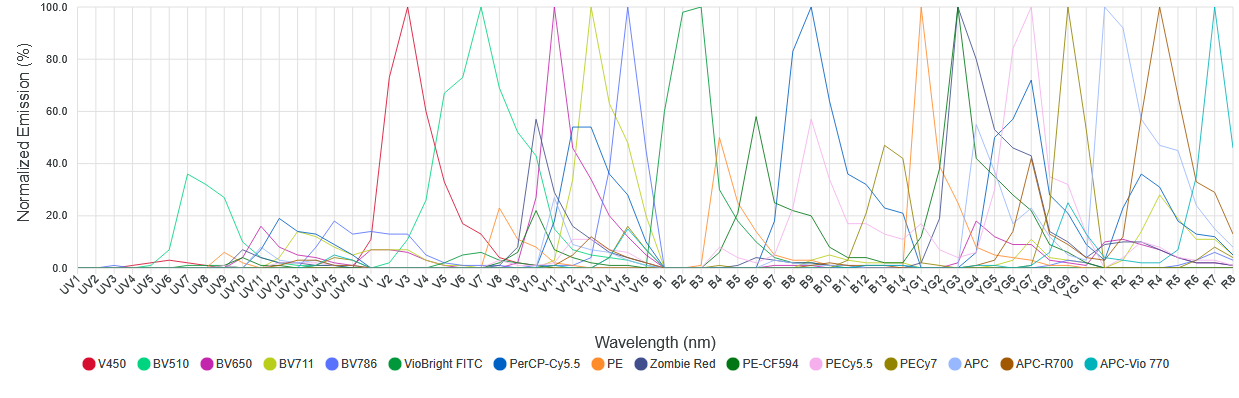
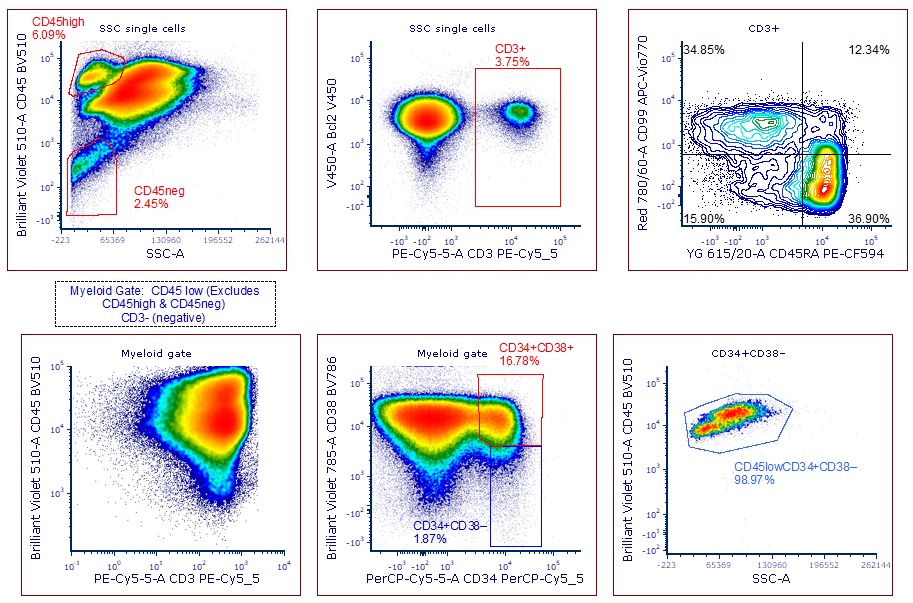 Optimized Multicolor Immunofluorescence Panels (OMIPs) are peer-reviewed panels designed for fluorescent assays. In the example below, data from OMIP-72 was access from the authors submission to https://flowrepository.org as per the original publication: https://onlinelibrary.wiley.com/doi/10.1002/cyto.a.24284. Data analysis was performed by the De Novo Software team in the example below
Download the full FCS Express layout template and sample data for OMIP-72 used in the examples below to explore the sample data or use as a template for your own results. If you do not yet own FCS Express open the published layout with the free FCS Express Reader to explore the data and see what FCS Express can do for your analysis.
OMIP-72 is originally published by Petersen MA, Bill M, Rosenberg CA. OMIP 072: A 15-color panel for immunophenotypic identification, quantification, and characterization of leukemic stem cells in children with acute myeloid leukemia. Cytometry A. 2021 Apr;99(4):382-387 The FCS Express layouts provided have no affiliation with the original publishers and are intended as a guide for researchers utilizing OMIP-72 with FCS Express with a similar configuration as the publication.
Learn more about the reagents used in OMIP-72 on the FluoroFinder website.

| View the OMIP-072 panel in EasyPanel |
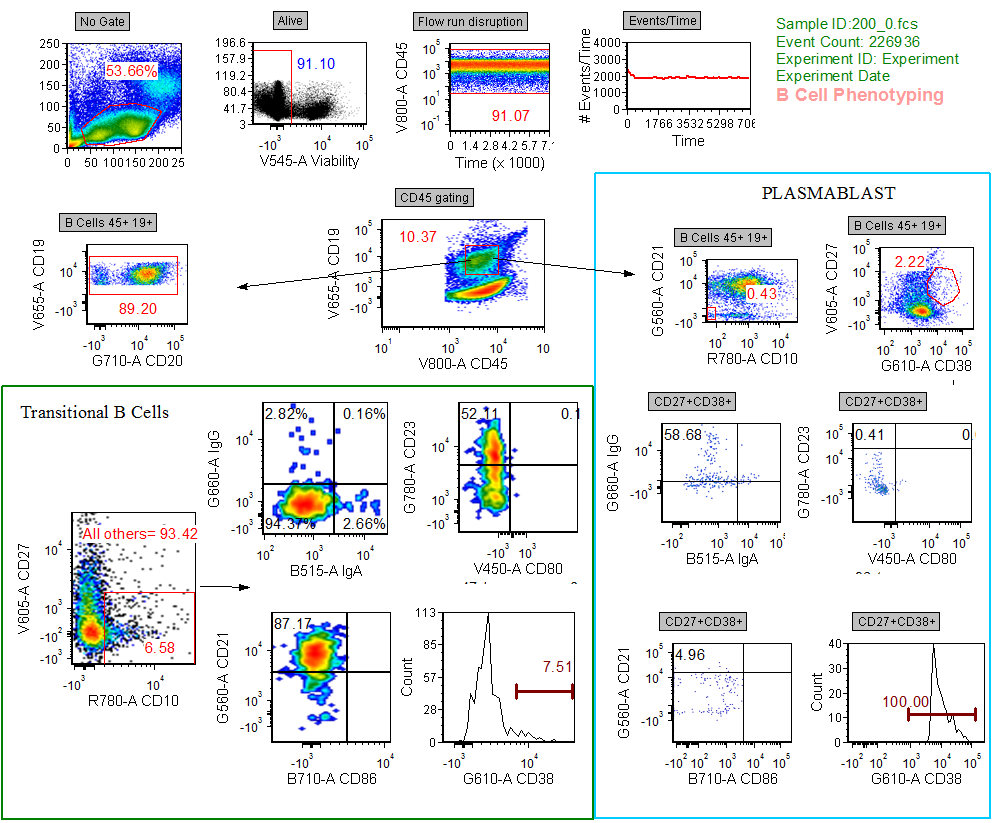
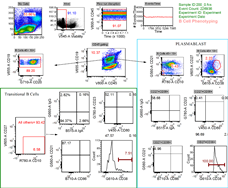 Phenotyping of cells is a common application in Flow Cytometry. FCS Express provides a way to conveniently report all cell type subsets, calculate custom statistics, and display data in bar charts for visualization
Download the PDF version of the Cell Phenotyping layout, or open the published layout with the free FCS Express Reader to see what FCS Express can do for your analysis.

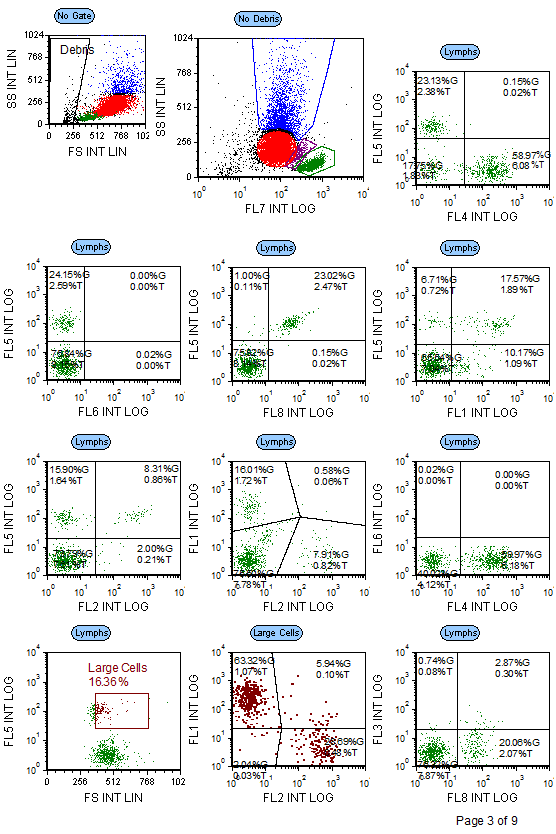
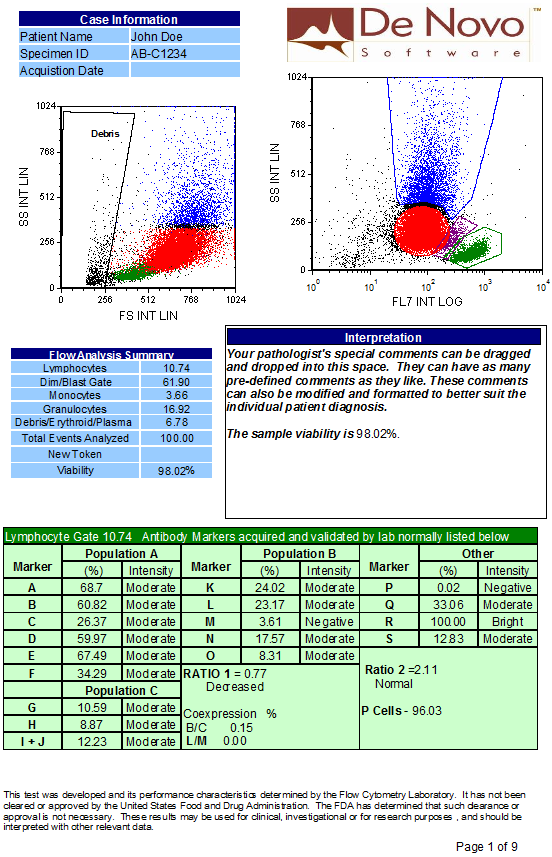
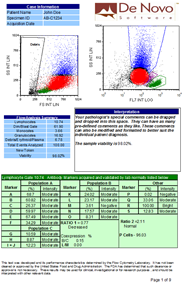 Clinical labs depend on FCS Express for sophisticated, yet easy to use flow cytometry analysis tools. Powerful custom statistics and reporting capabilities makes analyzing data in FCS Express efficient for any clinical professional.
Download the PDF version of a clinical-style report in FCS Express, or open the published clinical-style report layout with the free FCS Express Reader to see what FCS Express can do for your analysis.
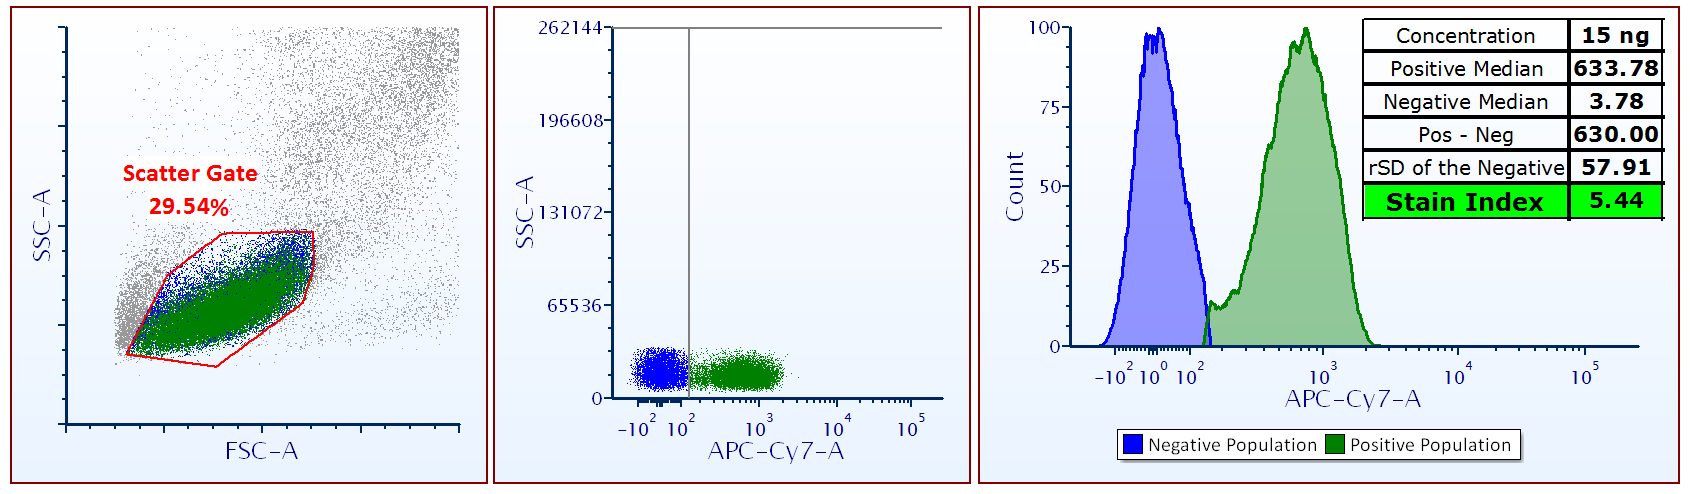
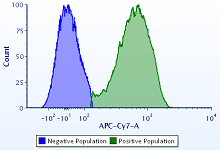 Stain index is easily calculated in FCS Express by using the stain index function from the Custom Tokens dialog. Simply drag and drop statistics from your plots or tables to enter the positive and negative median values for the formula as well as the negative population standard deviation. Once complete, the custom token for Stain Index will update in real time as gates or data change in your analysis. View our Stain Index information page for more details on how and why to use the Stain Index metric.
View our example Stain Index data in FCS Express using the free reader, or your current FCS Express license. You can also view the layout as a PDF.
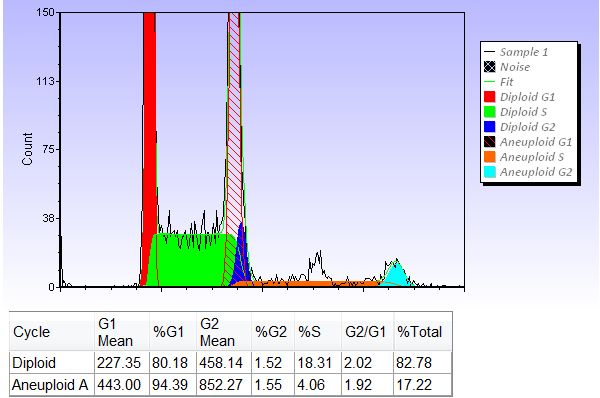
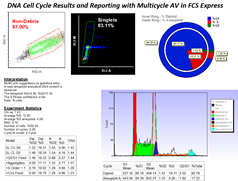 One of the earliest applications of flow cytometer was the measurement of DNA content in cells. The analysis is based on the ability of certain dyes to stain cellular DNA in a stoichiometric manner and DNA content histograms require mathematical analysis in order to extract the underlying G1,S, and G2 phase distributions.
The seamless combination of the Multicycle AV and FCS Express allows for quick modeling and fast reporting of your cell cycle data. Download the PDF version of the layout, or open the Cell Cycle Statistics & Reporting layout with the free FCS Express Reader.

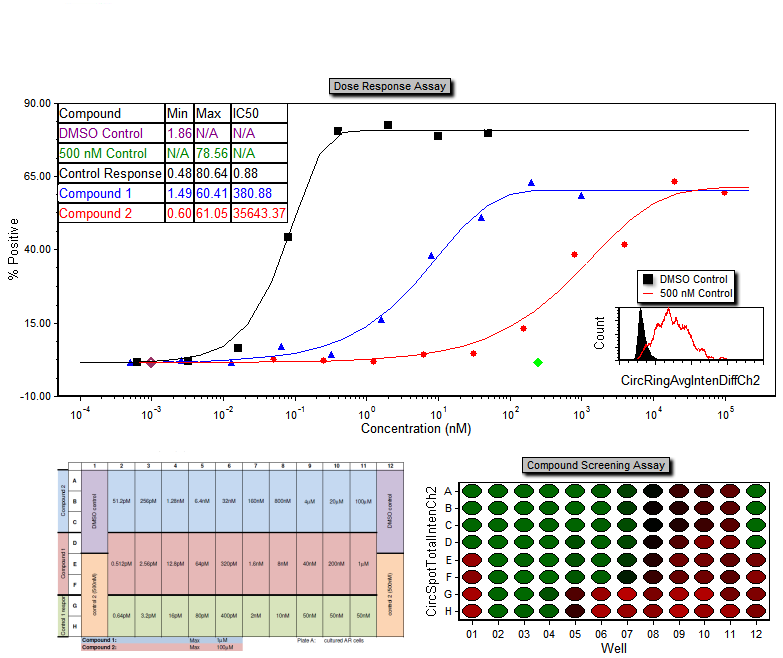
 The High Content feature for FCS Express allows you to plot any plate based analysis in heat maps, derive plate and well based statistics, and use well gates to isolate wells, groups of well, and populations of interest.
Download the PDF version of the High Content Analysis layout to see how easy it is to report your high content results in FCS Express, or examine the High Content Analysis & Reporting layout in more detail with the free FCS Express Reader.
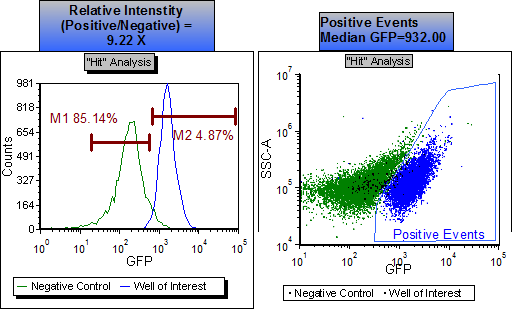

 FCS Express compliments any high content system by providing easy to use software with robust reporting, statistical, and batch processing features. FCS Express works at the plate, well, and single cell level and can generate dose response curves that update dynamically as gates are adjusted.
Explore the layout using the free FCS Express Reader: Dose Response Assay or download a PDF version: Dose Response PDF.
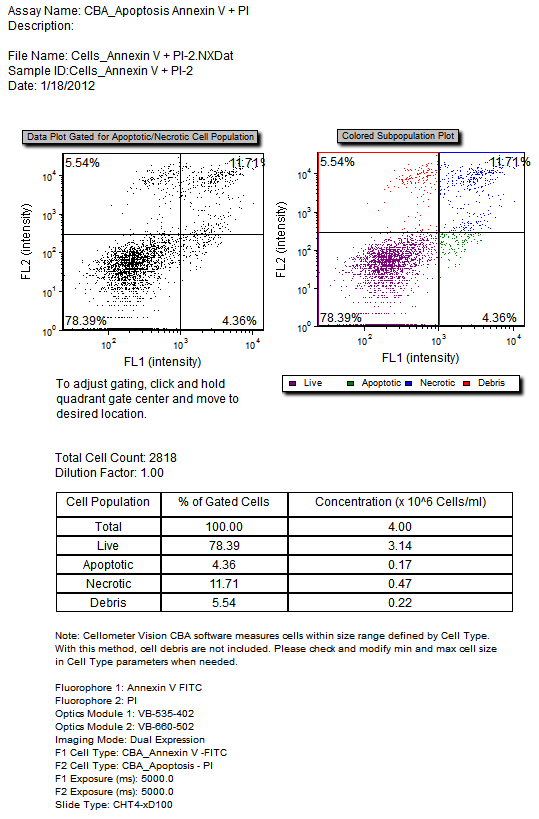
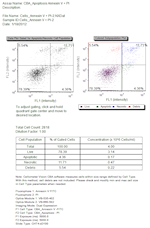 Cellometer Vision was developed to count total cells and identify FITC-annexin-V positive apoptotic cells based on the microscopic and fluorescence characteristics of the cell sample. Detection typically takes less than 60 seconds and only requires 20µl of cell sample. Cell images and all analysis data, including cell size distribution histograms, can be saved for documentation. Data can also be easily exported to FCS Express and utilize the Image Cytometry features for further analysis.
Download and view the layout using the free FCS Express Reader: Nexcelom Apoptosis Assay, or view the Nexcelom Apoptosis Assay PDF. For more information about this assay, visit the Nexcelom website.
Would you like to see your Flow Cytometry Application in this list? If so please email us at support@denovosoftware.com.