Pipelines

Build the Right Tools for Your Analysis

Today's researchers are often met with algorithmic black boxes and complex programming requirements when reaching for the latest method to prepare and analyze their data. FCS Express offers a solution tailored to the individual needs of your data with Pipelines. Skip the complex scripts, stop reaching for R, or worrying about programming. With Pipelines you can tailor each algorithm to fit your needs directly in FCS Express - no plugins required.

Control Over Your Data Processing

Pipelines are a set of data processing steps that stand alone or are connected in series. The output of a step can be applied to a data file or utilized as the input of the next step, or series of steps. Go from raw data to results step-by-step. Pipelines provide the control and flexibility you need for data processing.

Easy to Use Interface - No Programming Required

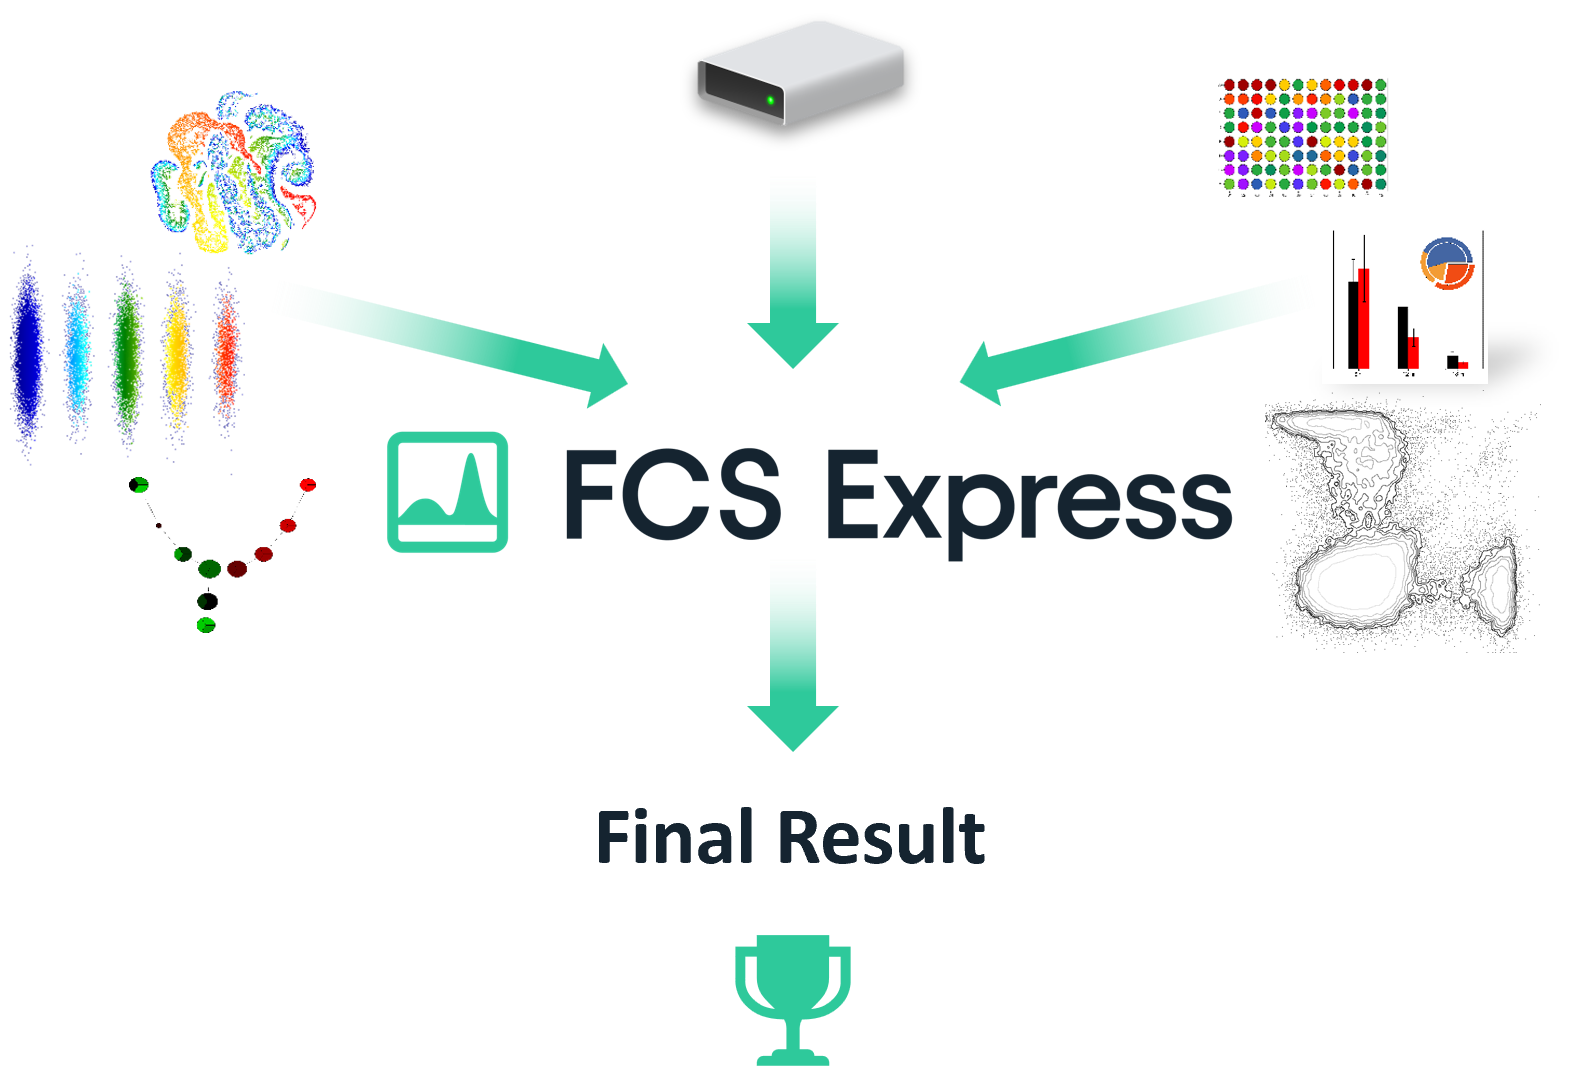
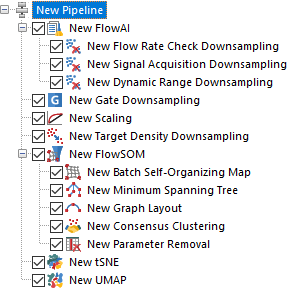
Pipelines enable researchers to use the flexible and intuitive interface of FCS Express to perform advanced data analysis and processing steps, without the need for external applications such as R or Python. No more writing complex programming scripts and having to rely on plugins. With FCS Express you have access to many of the most common and cutting-edge data analysis tools directly in the software. If you need R or Python integrations, we'll support that too!

From Pre-Defined Algorithms to Custom Pipelines

FCS Express provides a wide variety of pipeline steps for you to choose from. Customize each step of your algorithm. Arrange the order of your data processing steps. Implement unique and flexible transformations that fit your data OR choose from our pre-defined options. Pre-defined pipeline steps make accessing commonly used algorithms and data processing steps easy - including FlowCut, FlowAIFlowSOM, SPADE and Phenograph with more to come!

Compatible with Flow and Image Cytometry Data

Pipelines are easily applied to both Flow and Image Cytometry data sets. When using Image Cytometry data sets, picture plots may be used to easily visualize derived parameters back on the image such as with tSNE/vSNE/UMAP/SPADE/FlowSOM/Phenograph and more!