Make the connection from plate to cell
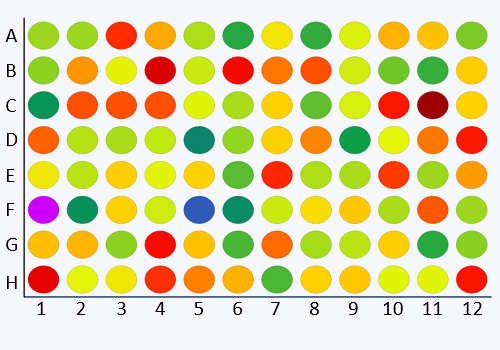
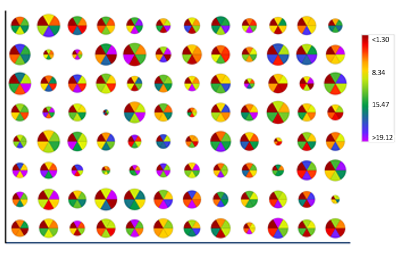
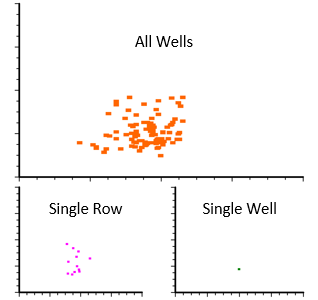
Heat maps will display the number of events and parameter based phenotypic data for all sorted events but wells may be gated on individually, or as groups, allowing users to back gate events onto other plots and quickly find individually sorted cells among the entire phenotype range.