Pre-defined Algorithms

Easy to Use Pre-assembled Tools for Your Analysis

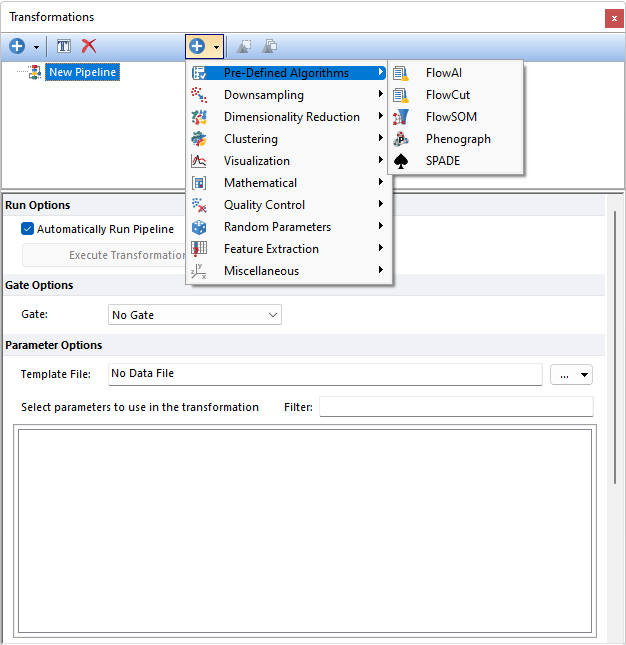
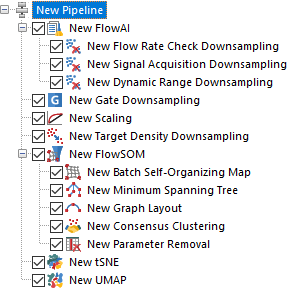
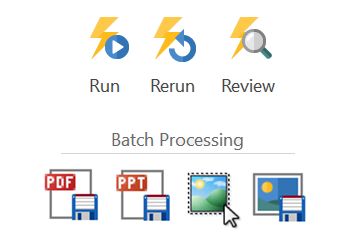
Researchers wanting to use the latest methods to prepare and analyze their data will no longer be hindered by complex programming requirements. FCS Express offers Pre-Defined algorithms for FlowAI, FlowCut, FlowSOM, SPADE or Phenograph in our new Pipelines. Skip the complex scripts, stop reaching for R, or worrying about programming. With these Pre-Defined algorithms in FCS Express you are only a few click away from preparing your data files and performing advanced analysis - no plugins required.
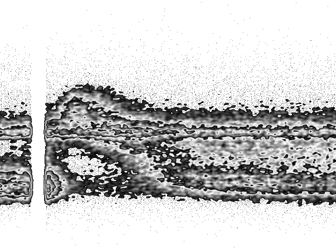
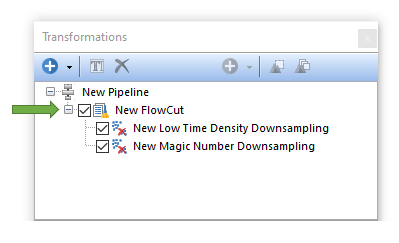
FlowCut

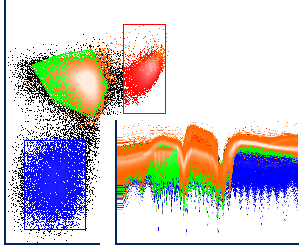
FlowCut allows the user to perform quality control on flow cytometry data in order to improve both manual and automated downstream analysis. FlowCut is a two step process: It first removes acquisition regions with fewer events and then cleans the remaining data based on multiple quality control tests.
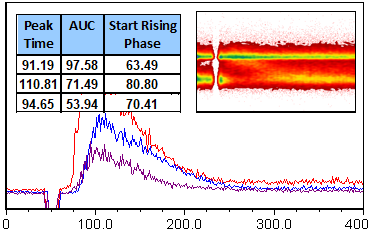
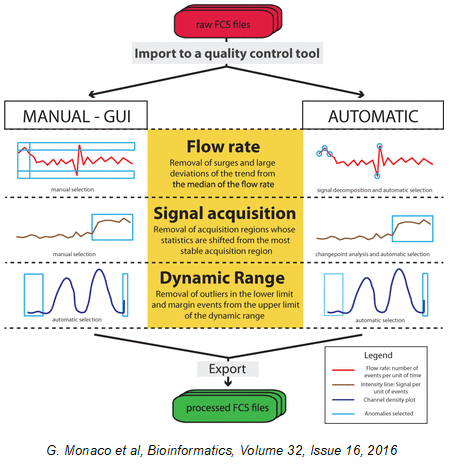
FlowAI

FlowAI an automatic and interactive tool to remove outliers and anomalies from your data files is readily available for your use in FCS Express.  This pre-defined pipeline step includes a flow rate check, signal acquisition, and dynamic range quality controls. Removing these lesser quality events allows for improved downstream basic and advanced analysis while generating superior, reliable, and reproducible results in FCS Express.
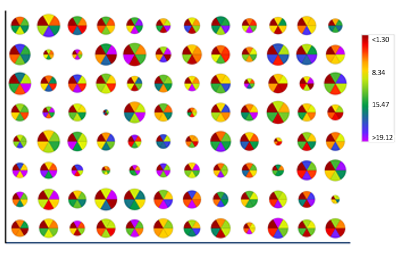
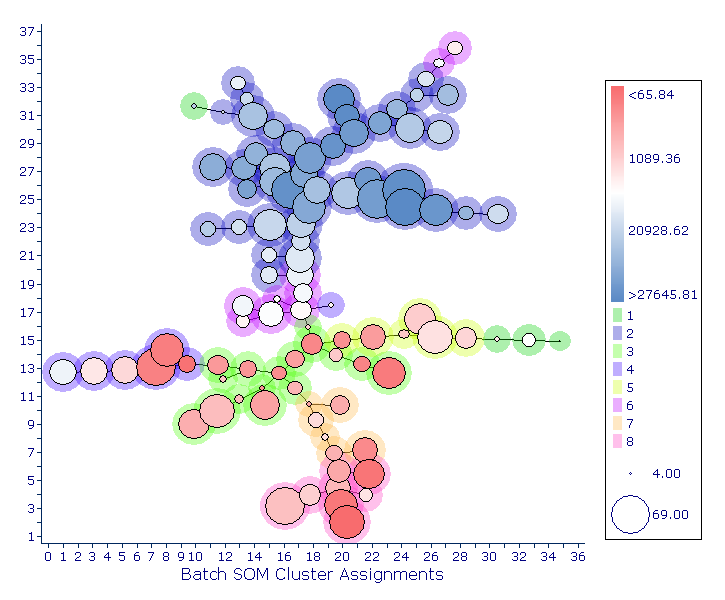
FlowSOM

Now accessible through FCS Express Pipelines as a pre-defined algorithm, FlowSOM is a clustering and visualization tool that facilitates the analysis of high-dimensional data. Clusters are defined based on the Batch Self-Organizing Map (Batch-SOM) algorithm, which is an enhanced implementation of the classical Self-Organizing Map algorithms. Clusters are then arranged in a Minimum Spanning Tree, that can help Researchers understand how markers included in their panel are behaving on all cells. A second clustering step (i.e., meta-clustering) is also performed, which can provide a basis for discerning biological similarity and can help detect groups that may have otherwise been missed.
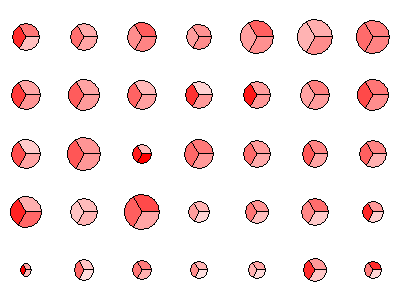
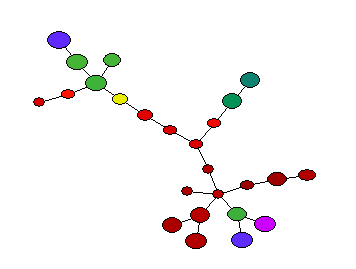
SPADE

SPADE (Spanning-tree Progression Analysis of Density-normalized Events) is a clustering algorithm that is complementary to existing analysis approaches available in FCS Express. As a pre-defined pipeline step, it is easy for FCS Express users to automatically identify cell populations in multidimensional cytometry data files without needing to assign a known cellular ordering.
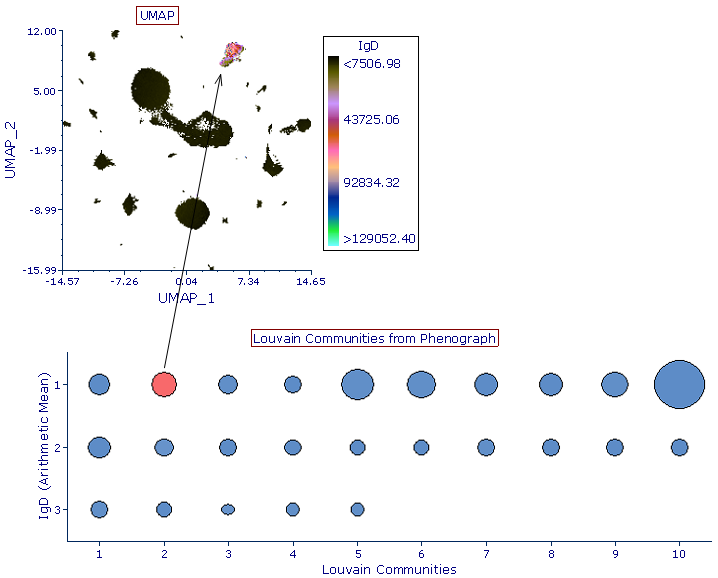
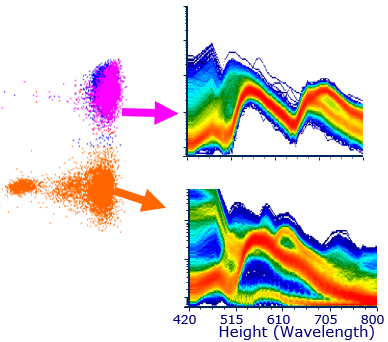
Phenograph

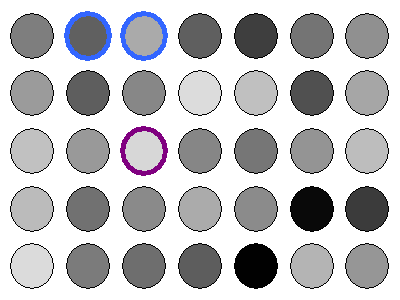
Phenograph is a clustering tool that facilitates the analysis of high-dimensional data. Phenograph first represents the high-dimensional data set with a graph structure. In this representation, each cell is represented as a node and is connected to its neighbors (i.e. the cells most similar to it) via an edge whose weight is set by the similarity between cells. Dense regions of cells will manifest as highly interconnected (i.e. high-density of edges) modules in this graph. Once constructed, the graph is partitioned into subsets of densely interconnected modules, called communities, which represent distinct phenotypic subpopulations.


Pipelines

Build the Right Tools for Your Analysis

Today's researchers are often met with algorithmic black boxes and complex programming requirements when reaching for the latest method to prepare and analyze their data. FCS Express offers a solution tailored to the individual needs of your data with Pipelines. Skip the complex scripts, stop reaching for R, or worrying about programming. With Pipelines you can tailor each algorithm to fit your needs directly in FCS Express - no plugins required.

Control Over Your Data Processing

Pipelines are a set of data processing steps that stand alone or are connected in series. The output of a step can be applied to a data file or utilized as the input of the next step, or series of steps. Go from raw data to results step-by-step. Pipelines provide the control and flexibility you need for data processing.

Easy to Use Interface - No Programming Required

Pipelines enable researchers to use the flexible and intuitive interface of FCS Express to perform advanced data analysis and processing steps, without the need for external applications such as R or Python. No more writing complex programming scripts and having to rely on plugins. With FCS Express you have access to many of the most common and cutting-edge data analysis tools directly in the software. If you need R or Python integrations, we'll support that too!

From Pre-Defined Algorithms to Custom Pipelines

FCS Express provides a wide variety of pipeline steps for you to choose from. Customize each step of your algorithm. Arrange the order of your data processing steps. Implement unique and flexible transformations that fit your data OR choose from our pre-defined options. Pre-defined pipeline steps make accessing commonly used algorithms and data processing steps easy - including FlowCut, FlowAIFlowSOM, SPADE and Phenograph with more to come!

Compatible with Flow and Image Cytometry Data

Pipelines are easily applied to both Flow and Image Cytometry data sets. When using Image Cytometry data sets, picture plots may be used to easily visualize derived parameters back on the image such as with tSNE/vSNE/UMAP/SPADE/FlowSOM/Phenograph and more!

Calculate Cell Concentration

Count on FCS Express to get your results in record time

When performing experiments where you need to relate to the original concentration of your sample it can be challenging to find the right tools to accurately and automatically determine absolute counts. With FCS Express, absolute counts can be determined easily by using reference beads, known volume or time. Just gate your beads or have FCS Express determine the volume or time from the data itself and the software will do the rest!

Concentration Calculator

The concentration calculator in FCS Express will allow you to perform “one off” calculations or set up your statistics so they are based on absolute cell counts. Simply use reference beads, flow rate, or volume information from the FCS file itself to get results instantly.

Calculate and report results easily

Reporting absolute counts is as simple as showing a statistics window. Once your concentration calculation is set up its easy to directly export results to Excel, PowerPoint, PDF, and more so you get the data and visualizations you need in a click.

Kinetics Analysis

When time matters, FCS Express has you covered

Most flow cytometers are capable of providing kinetics data by recording a time parameter in the FCS file but making sense of that information to examine DNA content, antibody binding, and calcium flux can often be challenging.  FCS Express offers the capability to display and analyze flow cytometry kinetics data in an easy and user friendly manner while updating your plots as your analysis changes, so you can make the most of your time.

Kinetics made easy

Kinetics plots offer the capability to display and analyze flow cytometry kinetics experiments seamlessly with any gates or plots. FCS Express will plot mean, medians, counts, above threshold, and any custom functions/formulas. From complex overlays of multiple samples to simple quality control, FCS Express has you covered.

Report results easily

Reporting results from flow cytometry kinetics data is simplified in FCS Express with direct exports to Excel, PowerPoint, PDF, and more so you get the results and visualizations you need in a click.

Display your data

Kinetics data can be analyzed and presented with numerous density, line, and backgating options to optimize displays for analysis while multiple populations or files may also be overlaid with ease.

Spectral Data Analysis

Move from spectra to results and back again with ease

Spectral flow cytometry is used to sample more parameters per single cell or particle than traditional flow cytometry but interpreting, reporting, visualizing, and communicating these results can be challenging. FCS Express includes the capability to read raw spectral data from Cytek and Sony instruments, so data can be easily analyzed and reported just like any other flow cytometry data. Spectral unmixing may also be performed through an easy to use wizard. Seamlessly move between spectral plots and standard flow cytometry plots, and take your analysis to the next level with FCS Express.

Spectral Data Analysis

With the capability to read raw spectral data from Cytek and Sony instruments in Spectrum Plots data can be analyzed just like any other flow cytometry data. Easy to use Spectral Unmixing tools in FCS Express allow you to unmix data sets post acquisition with ease

Report results easily

Reporting results from spectral data is simplified in FCS Express with direct exports to Excel, PowerPoint, PDF, and more so you get the results and visualizations you need in a click.

Perform unmixing with ease

To create an unmixing matrix in FCS Express simply use the Automatic Unmixing Setup wizard. The unmixing wizard functions similarly to the FCS Express compensation wizard making it easier than ever to move from standard flow cytometry data analysis to spectral data analysis. Select your single stain controls, parameters to unmix, and build histograms which will automatically set gates on positive an negative populations. Choose to calculate the matrix and get off and running with your analysis and reporting.

Display your data

Spectral data can be analyzed and presented with numerous density, line, and backgating options to optimize displays for analysis while multiple populations or files may also be overlaid with ease.

Big Experiments? Big Data? No Problem!

You never have to sacrifice the quality of your reports and figures due to the size of your experiments, number of parameters, or number of data files with FCS Express. The easy to use batch processing feature in FCS Express allows you to export at the same quality across any number of samples, to multiple formats at the click of a button.


High Content Analysis

FCS Express has you covered from plate to single cell

When working with flow or image cytometry data acquired in plate based formats it can be difficult to move between the plate, well, and single cell level and often times many software packages might be needed to perform specific tasks in the high content workflow. With the high content analysis tool in FCS Express you can work in any size plate format with flow or image cytometry data sets to quickly analyze many plates, large numbers of samples, and drill down to the single cell level when needed. Summary results from screens and assays may be quickly reported in many formats so you can move from data to results most efficiently.

How does it work?

Heat maps for flow cytometry data analysis allow you to display and work with your samples in a plate-based format no matter the size of the plate or files. Each sample will be represented in well of the heat map which may be gated individually or as a group of wells. Statistics and summary data is easily collated in FCS Express so you can quickly validate "hits" or generate regression curves for IC/EC 50 assessment.

Visualizing Data

Heat Maps allow you to quickly view your entire plate in a single click. Overlays allow a user to view up to six statistics and/or parameters on a single heat map so visualizing multi-marker flow cytometry assays becomes easy. Users may also add a radius statistic, which changes the size of the well to reflect the selected statistic.

Compatibility

FCS Express continues a legacy of innovation in the field by providing analysis capabilities for multiwell plate format flow cytometry and imaging data. Compatible instruments, and software, include BD HTS, Guava, Coulter Quanta, MACSQuant, Hypercyte, Sony, Accuri, Cell Profiler, Nexcelom Celigo, Thermo ArrayScan, and much more.

Make the connection from plate to cell

Heat maps will display the number of events and parameter based phenotypic data for all events but wells may be gated on individually, or as groups, allowing users to back gate events onto other plots and quickly find individual cells and populations among the entire phenotype.

Regression Analysis

FCS Express enables the calculation of regression fits directly from your wells, gates and statistics from your flow cytometry experiment. You can overlay a regression with the click of a button. Most importantly, your regression formulas, line fits, and analysis can all be linked directly to your plate based data allowing you to view changes to your regression analysis in real time as gates and data are adjusted.

BD FACS Diva and Accuri Importers

Easily import your BD FACS Diva experiments and Accuri layouts

If you have ever spent any time recreating an analysis, plots, gates, hierarchies, and scalings based on your acquisition software then you know how time consuming it can be. With FCS Express, you can easily import your FACS Diva Experiment or Accuri files to pick up at analysis where you left off at acquisition. That even means you can have the same exact gates from your sorts directly imported in FCS Express!

Import BD FACS Diva Experimets

The BD FACS Diva Importer in FCS Express allows you to import your entire experiment Diva experiment file so you can pick up in FCS Express where you left off in Diva. FCS Express preserves all acquisition templates and analysis worksheets, gates, gating hierarchies, markers, quadrants and plot scaling when importing your experiment. Once you import to FCS Express you can use all of the advanced reporting and visualization tools while never having to recreate a gate.

Import BD Accuri C6 Experiments

The BD Accuri C6 Software Importer allows you to import your entire experiment from Accuri C6 and C6 Plus systems. FCS Express will import all of the experiment information from the BD Accuri C6 Software files including all plots on the Collect and Analyze tab, the native high resolution 24 bit FCS data, all gates, gating hierarchies, markers, quadrants, plot formatting and scaling settings.

Integrated Spreadsheets

Imagine having the power of Excel with results linked directly to your flow cytometry gates

Flow cytometry data analysis rarely ends with plots and raw statistics so you probably spend a lot of time copy and pasting from your current analysis package to Excel and other charting software to generate your final result. Then what happens when you need to change a gate? You have to do it all over again. With FCS Express spreadsheets can be accessed directly in your analysis and linked up to your gates and data files. As gates move and data changes, so do your spreadsheets in real time.  Say good bye to copy and paste and hello to results!

Statistics made easy

Values in Spreadsheet cells may be derived directly from any gate or statistic, keywords, or from all your flow cytometry data files with one drag and drop. Spreadsheet cells are easily filled by dragging and dropping your data files or statistics right into the spreadsheet.

Formatting

Spreadsheets in FCS Express share many of the common formatting features of Excel so you will be able to sort, merge, use conditional formatting, insert/remove columns/rows, format text, and much more without having to open two software packages or copy and paste.

Formulas

Almost all of the of the formula features and operations that Microsoft Excel provides are included in FCS Express with the added advantage that formula results can be directly linked to any plot or gate based statistic. Imagine the power of moving a gate and having p-values, t-tests, and other advanced statistics from your flow cytometry data analysis update immediately.

Charts

Data in spreadsheets can also be visualized in Pie charts, Bar plots, Scatters plots, and Regression charts with a click. FCS Express eliminates the middle man of copy and pasting to Excel by linking up with your gates and statistics so you can get results in real time.

Publishing

Share your analysis!

Researchers,  CRO's, Clinical Labs, Scientific Vendors, and Educators all have one thing in common. They often need to share analysis with someone else. Whether that be colleagues, clients, pathologist, customers, or students, the unique publishing features of FCS Express allow you to share your analysis in an easy and secure way that can be opened by everyone directly in FCS Express with the free Reader. That means whomever you need to collaborate with most effectively can view, gate, and edit an analysis you created.

How does it work?

Layouts are published from your licensed copy of FCS Express and can be stored or shared from your local computer, your own cloud solution or ours. Published layouts can then be opened by anyone in the free FCS Express Reader so your collaborators can view, edit, and even re-gate the analysis. It's as simple as that!

For Scientists

Consult with colleagues around the world without having to worry about them having software available to change gates and comment on your results. Sharing a live analysis is more efficient and effective than sharing an image of it!

For Educators

Provide your students with ready-made analysis templates and assignments  in the form of an analysis to let them focus on the specifics of your lesson. Because FCS Express is also a full presentation software, you can embed instructions, lines, arrows and many other visual aids to help students to understand your lesson while they analyze real data. By letting your students save changes in the layouts they can send it back to you for review, grading, and advice.

For Vendors

You can publish examples of your reagents in action with real data so that your customers can see what they look like during analysis. Publishing also allows your potential customers to interact with your data examples directly while customers with FCS Express can publish layouts for you to view for assistance with technical questions and troubleshooting.

For CROs and Clinical Labs

Finally, you can provide full, unlimited Virtual Flow for your clients. Give your clients access to your entire live analysis, not just an image of it. Don't want to give full permissions? No problem, you can restrict specific actions and lock down your analysis with advanced publishing tools.


Quadrants Made Easy

Flexibility and ease of use no matter how complicated your flow cytometry gating strategy may be

Quadrants are often used in Cytometry to divide plots in four, mutually-exclusive, areas for analysis and results. Managing, gathering statistics, and reporting results from quadrant based analysis can be challenging in other software packages.  FCS Express allow you to easily create, move, and link quadrants so you can get the results you need when you need them. All quadrant based results will update immediately as you move vertices so you can easily interrogate your populations of interest at a click.

Quadrant types

FCS Express supports customization of quadrants so you can get the flow cytometry results you need. When populations do not fall in perfect 90 degree patterns, Floating quadrants allow you set any vertices independently. Percentile quadrants even let you automatically set quadrants based on data or controls themselves.

Quadrant Gates

To save you time in your analysis, when quadrants are added to a plot, one gate for each quadrant is automatically created. These quadrant gates can be used in your downstream analysis. Quadrant gates function like any other gate, allowing you to move from populations to results quickly and easily.

Quadrant to Quadrant linking

The centerpoint of one set of quadrants can be linked to the centerpoint of another set of quadrants so that when the centerpoint on one plot is moved, the centerpoint on the other plot will be automatically updated. With FCS Express there is no need to try and match up your control and sample quadrants because they can be quickly linked to update automatically in real time when performing flow cytometry data analysis.