Transformations

Perform tSNE, UMAP, SPADE, FlowSOM, PCA, Clustering and More...

Acquiring highly multi-parametric flow cytometry data sets is becoming more routine with the advent of new instrumentation and reagents but challenges remain to distill the information into visualizations that can be easily assessed and reported. Data transformation algorithms in the form of tSNE, UMAP, FlowSOM, SPADE, kMeans, Principal Component Analysis (PCA), and others have been developed to help meet those needs. FCS Express allows researchers to easily access and use these tools without relying on complicated scripting or plugins by integrating in an intuitive interface with drag and drop functionality.

Dimensionality Reduction

FCS Express integrates both t-SNE and UMAP via an easy to use interface where you simply select the parameters from your flow cytometry data to include and choose the variables for the algorithm to run. Drag and drop the transformation to any plot to calculate and view the results. Transformed result may be displayed in any plot type in FCS Express and further be colored with density or heat mapping to get you the results you need with publication ready quality.

SPADE

SPADE trees are easily created and displayed in heat maps where each cluster is depicted as a node of the branched tree. Heat maps may be formatted to color each node based on the expression of a given marker or based on any statistic associated with the cluster. Moreover, the size of each node can be displayed proportional to a given statistic allowing you more flexibility to get the results you need from your flow cytometry data, all at publication ready quality.

FlowSOM

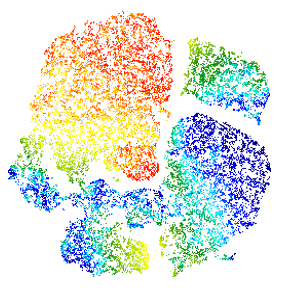
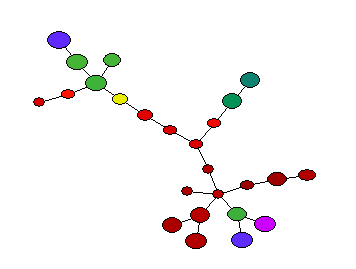
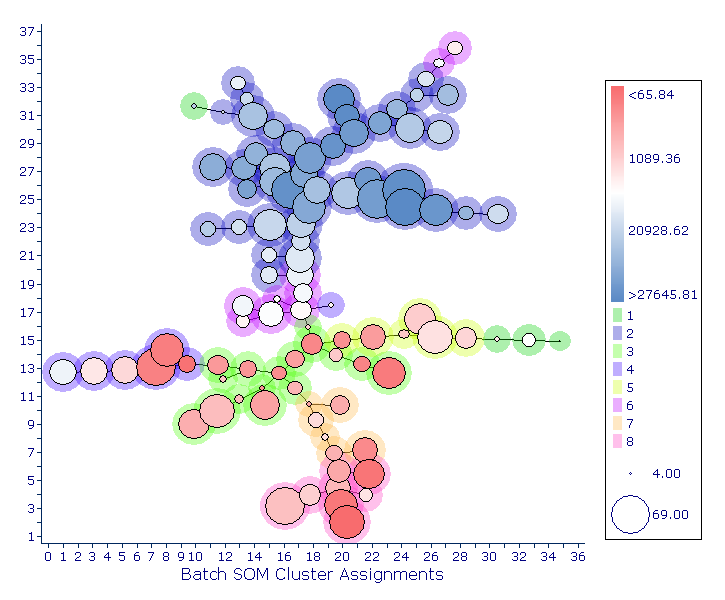
FlowSOM is a clustering and visualization tool that facilitates the analysis of high-dimensional data. Clusters are arranged via a Self-Organizing Map (SOM), in which events within a given cluster are most similar to each other, followed by those within an adjacent cluster.  A second clustering step (i.e., meta-clustering) is subsequently performed, in which the clusters themselves are grouped according to similarity, and provides a basis for discerning biological similarity. In FCS Express, FlowSOM is visualized with Heat maps.

K-Means Clustering

K-Means clustering allows you to quickly perform cluster analysis and review your clustered results in histograms, 2D plots, and heat maps. Clusters may easily be gated, back gated, and further integrated into your analysis and report with the simple drag and drop.

Pipelines

Pipelines enable researchers to use the flexible and intuitive interface of FCS Express to perform advanced data processing and analysis step-by-step, without the need for external applications such as R or Python. No more writing complex programming scripts and having to rely on plugins. With FCS Express you have access to many of the most common and cutting-edge data analysis tools directly within the software.

Parameter Math

If you have ever needed to create a ratio of parameters or perform another custom calculation at the event by event level then Parameter Math is for you. Parameter Math allows you to perform any mathematical function on your data parameters including sequences of formulas and may be set up to automatically perform calculations on your data as it is loaded into FCS Express so you can get results faster than ever.

Principal Component Analysis

Principal Components Analysis may allow you to find and analyze new populations of interest based on transformations of existing parameters or even allow you to use less parameters to analyze the same data set. Principal components defined and applied to a plot in FCS Express are accessible for analysis as new parameters on plots.

R Integration

If you prefer to use your own algorithms or scripts others have developed FCS Express seamlessly integrates your flow cytometry data with R to load your scripts, apply the transformation to your data sets, and get results with a simple drag and drop to a plot.