Pre-defined Algorithms

Easy to Use Pre-assembled Tools for Your Analysis

Researchers wanting to use the latest methods to prepare and analyze their data will no longer be hindered by complex programming requirements. FCS Express offers Pre-Defined algorithms for FlowAI, FlowCut, FlowSOM, SPADE or Phenograph in our new Pipelines. Skip the complex scripts, stop reaching for R, or worrying about programming. With these Pre-Defined algorithms in FCS Express you are only a few click away from preparing your data files and performing advanced analysis - no plugins required.

FlowCut

FlowCut allows the user to perform quality control on flow cytometry data in order to improve both manual and automated downstream analysis. FlowCut is a two step process: It first removes acquisition regions with fewer events and then cleans the remaining data based on multiple quality control tests.

FlowAI

FlowAI an automatic and interactive tool to remove outliers and anomalies from your data files is readily available for your use in FCS Express.  This pre-defined pipeline step includes a flow rate check, signal acquisition, and dynamic range quality controls. Removing these lesser quality events allows for improved downstream basic and advanced analysis while generating superior, reliable, and reproducible results in FCS Express.

FlowSOM

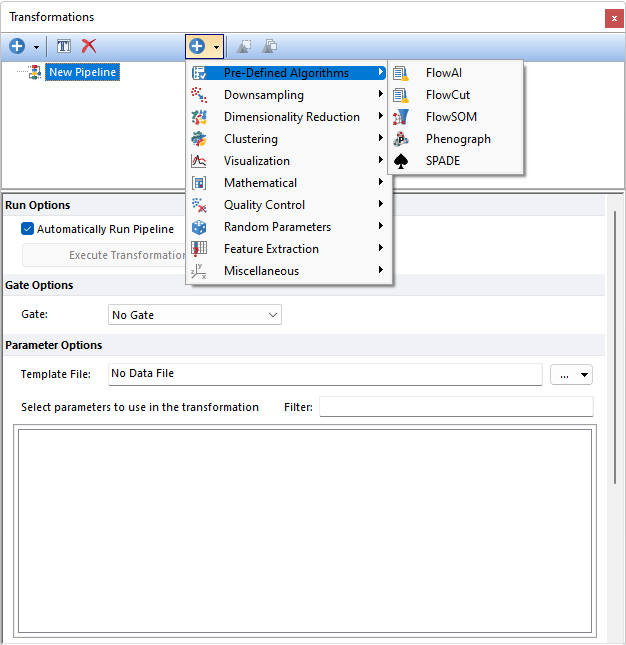
Now accessible through FCS Express Pipelines as a pre-defined algorithm, FlowSOM is a clustering and visualization tool that facilitates the analysis of high-dimensional data. Clusters are defined based on the 
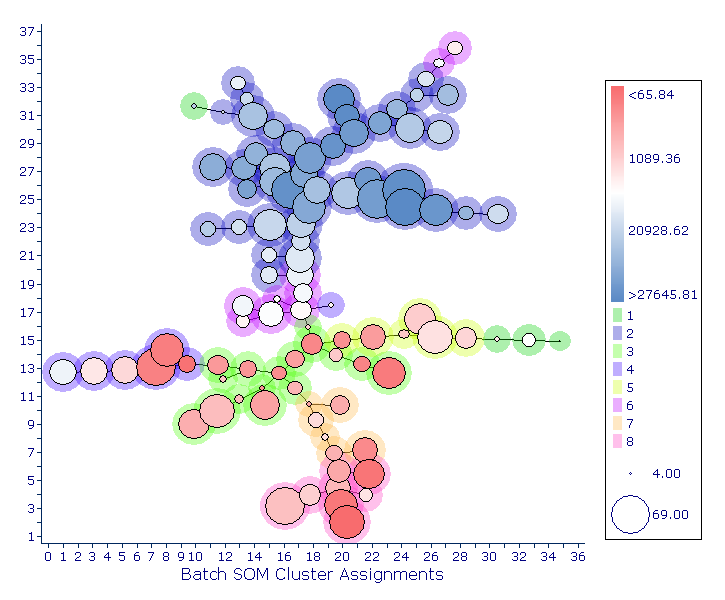
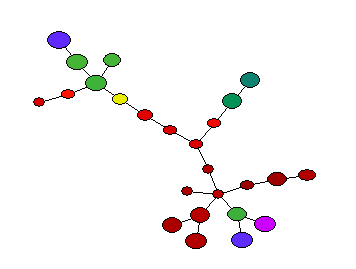
Batch Self-Organizing Map (Batch-SOM) algorithm, which is an enhanced implementation of the classical Self-Organizing Map algorithms. Clusters are then arranged in a Minimum Spanning Tree, that can help Researchers understand how markers included in their panel are behaving on all cells. A second clustering step (i.e., meta-clustering) is also performed, which can provide a basis for discerning biological similarity and can help detect groups that may have otherwise been missed.

SPADE

SPADE (Spanning-tree Progression Analysis of Density-normalized Events) is a clustering algorithm that is complementary to existing analysis approaches available in FCS Express. As a pre-defined pipeline step, it is easy for FCS Express users to automatically identify cell populations in multidimensional cytometry data files without needing to assign a known cellular ordering.

Phenograph

Phenograph is a clustering tool that facilitates the analysis of high-dimensional data. Phenograph first represents the high-dimensional data set with a graph structure. In this representation, each cell is represented as a node and is connected to its neighbors (i.e. the cells most similar to it) via an edge whose weight is set by the similarity between cells. Dense regions of cells will manifest as highly interconnected (i.e. high-density of edges) modules in this graph. Once constructed, the graph is partitioned into subsets of densely interconnected modules, called communities, which represent distinct phenotypic subpopulations.