Intuitive and Familiar Office® Interface

If you can use PowerPoint®, you can analyze in FCS Express

Learning how to use software should not be an impediment to getting results from your data. FCS Express is designed to look, feel, and work like many familiar Microsoft Office programs so you are already half way to being an expert with the software before you even get started. The unique graphical user interface of FCS Express actually represents how your report will be exported to PowerPoint, PDF, or printed. No longer do you have to spend hours learning software, guess how your reports and results will be exported, or sift through endless windows of plots. FCS Express simply helps you move from data to results.

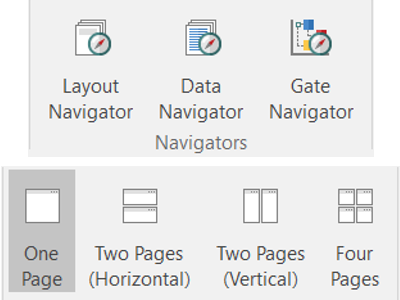
Familiar ribbon-tab interface

Due to its familiar interface, FCS Express is easy to learn. The customizable ribbon to make it even easier to access the tools you need. Use familiar mouse clicks and keyboard shortcuts to copy, paste, and more. Align, format, group, and order plots and tables as quickly as you can in Microsoft Office®.

Unlimited undo and redo

Mistakes during analysis are inevitable, but you can work boldly with the peace of mind, knowing that you can undo and redo every action you make in your analysis.

Simplify complex workspaces

Don't get lost in dozens of windows and endless open plots. A unified workspace with dockable and pinnable navigators, multiple pages views, and quick access to all aspects of your analysis makes analyzing and exploring the most complex data sets a breeze.

Export directly to PowerPoint®

Not only does FCS Express function like PowerPoint®, but also it exports directly to PowerPoint® with a single click. PowerPoint exports from FCS Express are high quality; all plots and objects are separate when they arrive in PowerPoint, so you can move, resize, and even ungroup them to be ready to present and publish.

Skip the Copy and Paste

In FCS Express, your analysis is your presentation, figure, or final report. Simply click to export directly to PDF, PowerPoint®, or in the image format of your choice at the resolution you need.

What you see is what you get

Avoid copying and pasting plots, images, or statistics into other software programs for editing and collating. Devote the time previously spent on these tasks to your science because what you see in FCS Express is what you get when exporting your analysis.