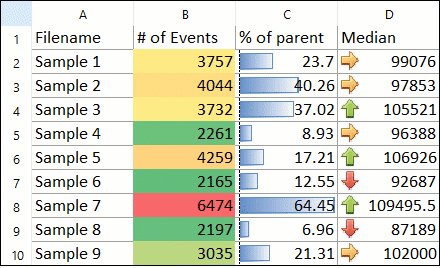
Integrated Spreadsheets

Imagine having the power of Excel with results linked directly to your flow cytometry gates

Flow cytometry data analysis rarely ends with plots and raw statistics so you probably spend a lot of time copy and pasting from your current analysis package to Excel and other charting software to generate your final result. Then what happens when you need to change a gate? You have to do it all over again. With FCS Express spreadsheets can be accessed directly in your analysis and linked up to your gates and data files. As gates move and data changes, so do your spreadsheets in real time.  Say good bye to copy and paste and hello to results!

Statistics made easy

Values in Spreadsheet cells may be derived directly from any gate or statistic, keywords, or from all your flow cytometry data files with one drag and drop. Spreadsheet cells are easily filled by dragging and dropping your data files or statistics right into the spreadsheet.

Formatting

Spreadsheets in FCS Express share many of the common formatting features of Excel so you will be able to sort, merge, use conditional formatting, insert/remove columns/rows, format text, and much more without having to open two software packages or copy and paste.

Formulas

Almost all of the of the formula features and operations that Microsoft Excel provides are included in FCS Express with the added advantage that formula results can be directly linked to any plot or gate based statistic. Imagine the power of moving a gate and having p-values, t-tests, and other advanced statistics from your flow cytometry data analysis update immediately.

Charts

Data in spreadsheets can also be visualized in Pie charts, Bar plots, Scatters plots, and Regression charts with a click. FCS Express eliminates the middle man of copy and pasting to Excel by linking up with your gates and statistics so you can get results in real time.