Publication-ready Histograms

See your flow cytometry data clearly with Histograms

Histograms are an integral aspect of flow and image cytometry data analysis, but researchers often spend too much time and resources in other software packages trying to visualize results and prepare figures for publication. With FCS Express, every aspect of your histograms maybe controlled to arrive at the perfect plot for day-to-day analysis or your next publication in Nature.

Marker-to-marker Linking

Markers easily are linked to each other by dragging and dropping end points together. Markers can be linked between different histograms or even to gates on 2D plots allowing you the ultimate flexibility for your flow cytometry data analysis.

Overlays made easy

Create histogram overlays with a simple drag and drop. Multiple samples may be overlaid on your histogram to assess different files for the same parameter or compare multiple parameters for one sample. There are no limits on the number of overlays, allowing you to get your flow cytometry results fast.

Change the perspective

Make your flow cytometry data stand out with three dimensional overlays or use our unique stacked overlay mode to get a clearer picture of your results.

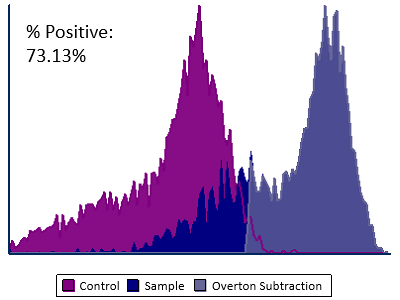
Histogram subtraction

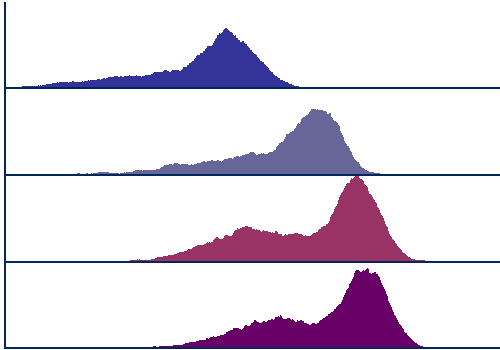
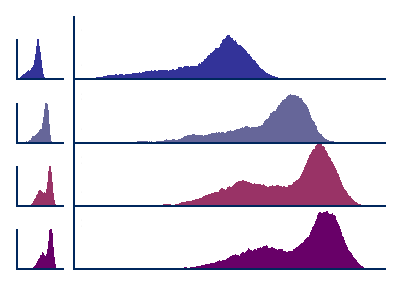
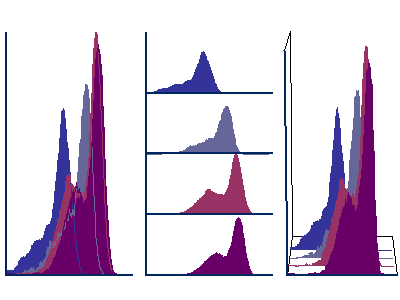
When positives and control populations are close together, the process of dividing positives from negatives can become less of a science and more of an art. FCS Express helps you put the science back again, using the Overton subtraction technique and others to tease apart populations.