High Content Analysis
FCS Express has you covered from plate to single cell
When working with flow or image cytometry data acquired in plate based formats it can be difficult to move between the plate, well, and single cell level and often times many software packages might be needed to perform specific tasks in the high content workflow. With the high content analysis tool in FCS Express you can work in any size plate format with flow or image cytometry data sets to quickly analyze many plates, large numbers of samples, and drill down to the single cell level when needed. Summary results from screens and assays may be quickly reported in many formats so you can move from data to results most efficiently.
How does it work?
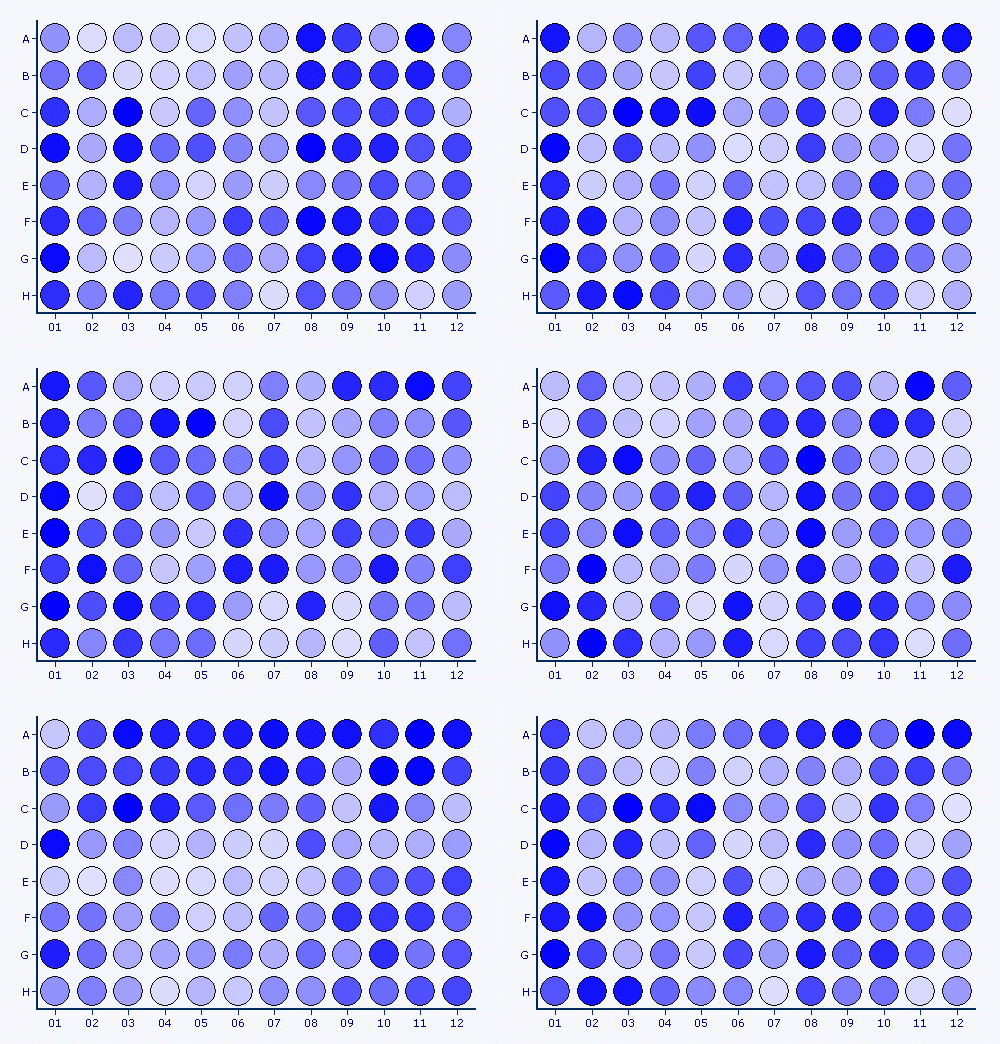
Heat maps for flow cytometry data analysis allow you to display and work with your samples in a plate-based format no matter the size of the plate or files. Each sample will be represented in well of the heat map which may be gated individually or as a group of wells. Statistics and summary data is easily collated in FCS Express so you can quickly validate "hits" or generate regression curves for IC/EC 50 assessment.
Visualizing Data
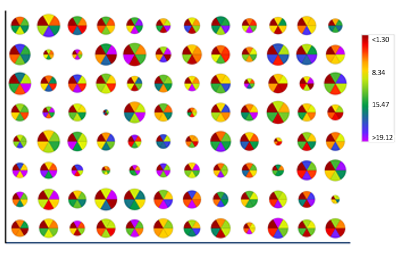
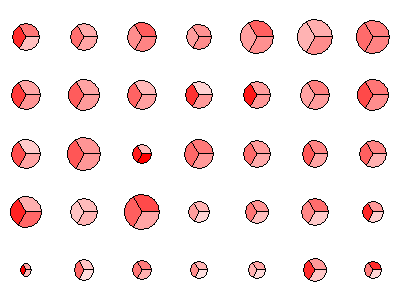
Heat Maps allow you to quickly view your entire plate in a single click. Overlays allow a user to view up to six statistics and/or parameters on a single heat map so visualizing multi-marker flow cytometry assays becomes easy. Users may also add a radius statistic, which changes the size of the well to reflect the selected statistic.
Compatibility
FCS Express continues a legacy of innovation in the field by providing analysis capabilities for multiwell plate format flow cytometry and imaging data. Compatible instruments, and software, include BD HTS, Guava, Coulter Quanta, MACSQuant, Hypercyte, Sony, Accuri, Cell Profiler, Nexcelom Celigo, Thermo ArrayScan, and much more.

Make the connection from plate to cell
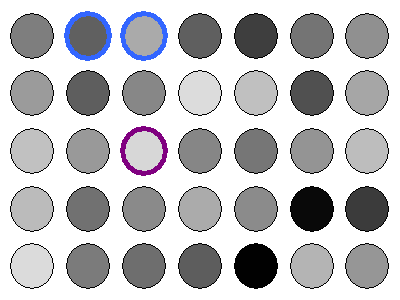
Heat maps will display the number of events and parameter based phenotypic data for all events but wells may be gated on individually, or as groups, allowing users to back gate events onto other plots and quickly find individual cells and populations among the entire phenotype.
Regression Analysis
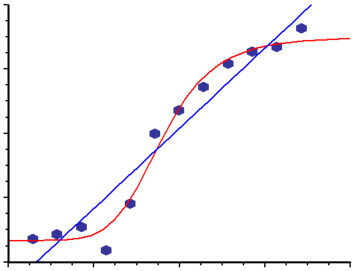
FCS Express enables the calculation of regression fits directly from your wells, gates and statistics from your flow cytometry experiment. You can overlay a regression with the click of a button. Most importantly, your regression formulas, line fits, and analysis can all be linked directly to your plate based data allowing you to view changes to your regression analysis in real time as gates and data are adjusted.
