Visualize Your Data Easily and Automatically

FCS Express Supports Seven Data Scaling Methods and Autoscaling for Flow Cytometry Data Analysis

There are a wide variety of ways that flow and image cytometry data is displayed in todays challenging environment. Depending on the instrument, and the parameters, data can displayed in different ways (i.e. linear, log, biexponential). You need a tool that can accommodate all the different scaling options required by different instruments on the market.

Automatic Axis Scaling

FCS Express supports all of the commonly used axis scalings for your flow cytometry data files. In most cases your data will appear exactly as it did during acquisition automatically so you can spend less time formatting plots and more time getting results.

Flexible Axis Scaling

When you need to change between different axis scalings simply choose from the FCS Express drop down which scale to apply to your data. All commonly used axis scalings for flow cytometry data analysis are available for use.

Instrument Specific Settings

Not all instruments are created equal with some data from instruments acquired with different maximum ranges. No matter what the dynamic range of your cytometer FCS Express has you covered with options to scale your plots automatically according to the cytometer type so all you have to do is analyze.

Display Data According to Your Needs

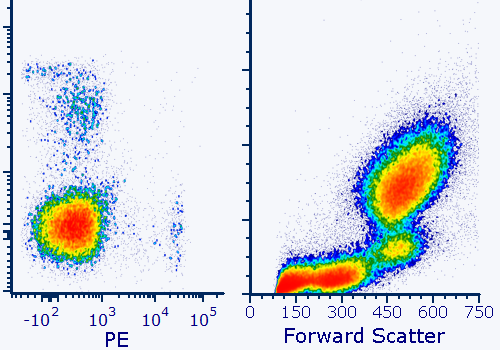
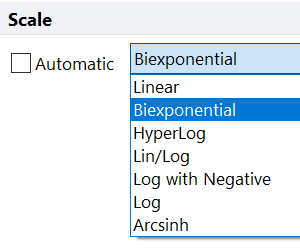
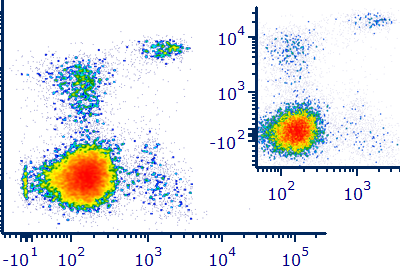
Axis scaling is performed on a plot-by-plot basis meaning that you can compare different scalings side by side to make sure you are making the best decisions when identifying populations in flow cytometry data analysis. When you are ready to share your results simply use the plot that best tells the story of your data.

Biexponential for BD FACS Diva

As a result of our close collaboration with BD, data files opened in FCS Express will look exactly as they did in Diva and use the same scaling/bi-exponential transition points.