Proliferation Analysis

FCS Express uses a sophisticated fitting process to get results fast

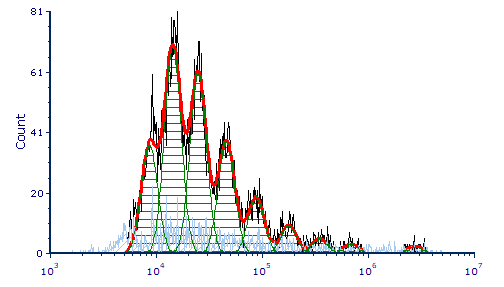
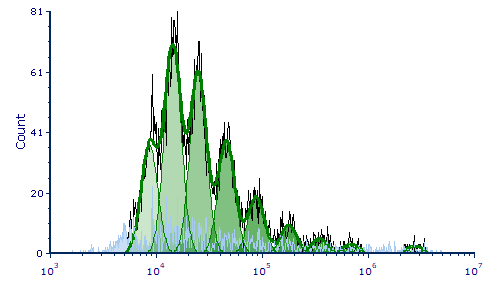
Flow cytometry assays to assess the proliferative activity of cells are commonly used for monitoring the health and growth rate of cells. In this type of assay, a cell tracking dye, such as CFSE, is incorporated into the cells. With each round of cell division, the relative fluorescent intensity of the dye decreases by half. Other software packages offer limited functionality to model the data or require you to use a separate software package completely. With FCS Express full descriptive statistics for modeling and per generation calculations along with the ability to fully format your plots will have you ready for publication in no time in one analysis package.
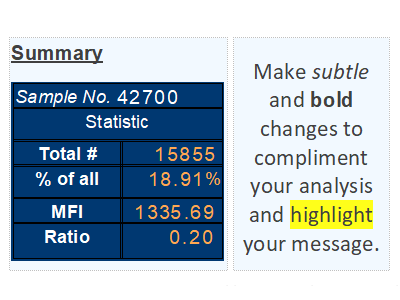
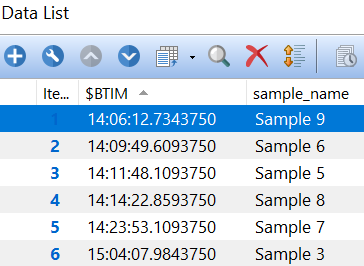
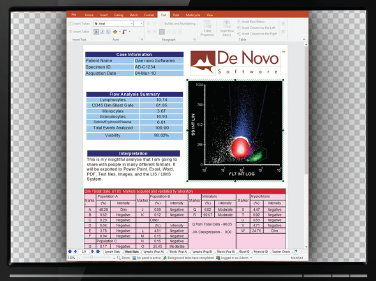
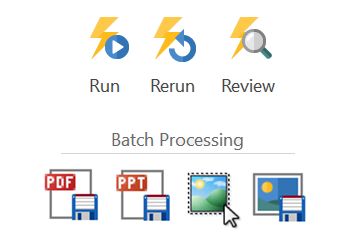
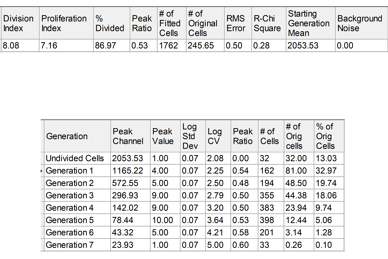
Statistics

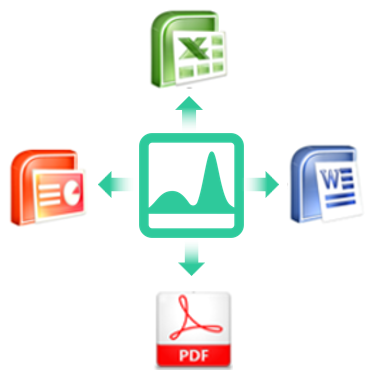
FCS Express provides a wide range of statistics about the results from the model. It is possible to export any statistic from your proliferation fit to Excel, create PowerPoint slides, save layouts, and more using sophisticated layout tools. Results will also update in real time with gate and data changes so you can get flow cytometry proliferation results from your populations of interest immediately.
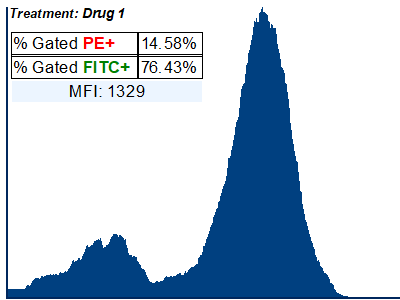
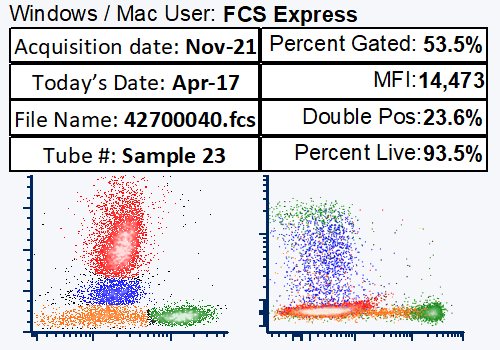
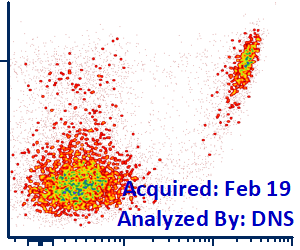
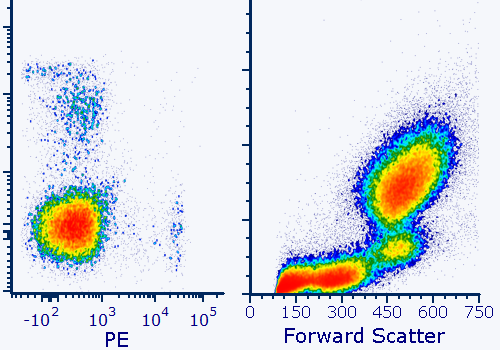
Custom Formatting

FCS Express allows you control every aspect of your proliferation plots so you are ready to present and publish directly from your analysis results.
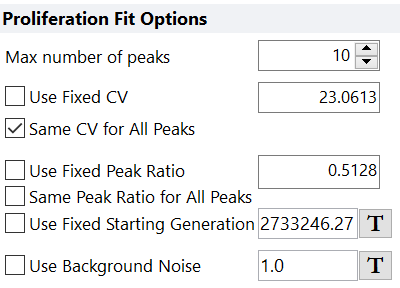
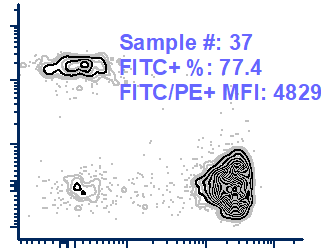
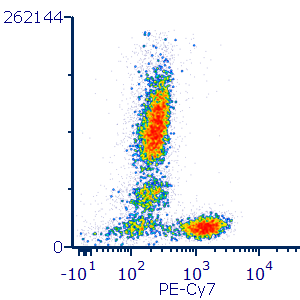
Flexible Fitting

Custom fitting options allows you to base your starting generation and background noise on controls while other variables can be adjusted to help model your flow cytometry data perfectly every time.

Intuitive and Familiar Office® Interface

If you can use PowerPoint®, you can analyze in FCS Express

Learning how to use software should not be an impediment to getting results from your data. FCS Express is designed to look, feel, and work like many familiar Microsoft Office programs so you are already half way to being an expert with the software before you even get started. The unique graphical user interface of FCS Express actually represents how your report will be exported to PowerPoint, PDF, or printed. No longer do you have to spend hours learning software, guess how your reports and results will be exported, or sift through endless windows of plots. FCS Express simply helps you move from data to results.

Familiar ribbon-tab interface

Due to its familiar interface, FCS Express is easy to learn. The customizable ribbon to make it even easier to access the tools you need. Use familiar mouse clicks and keyboard shortcuts to copy, paste, and more. Align, format, group, and order plots and tables as quickly as you can in Microsoft Office®.

Unlimited undo and redo

Mistakes during analysis are inevitable, but you can work boldly with the peace of mind, knowing that you can undo and redo every action you make in your analysis.

Simplify complex workspaces

Don't get lost in dozens of windows and endless open plots. A unified workspace with dockable and pinnable navigators, multiple pages views, and quick access to all aspects of your analysis makes analyzing and exploring the most complex data sets a breeze.

Export directly to PowerPoint®

Not only does FCS Express function like PowerPoint®, but also it exports directly to PowerPoint® with a single click. PowerPoint exports from FCS Express are high quality; all plots and objects are separate when they arrive in PowerPoint, so you can move, resize, and even ungroup them to be ready to present and publish.

Skip the Copy and Paste

In FCS Express, your analysis is your presentation, figure, or final report. Simply click to export directly to PDF, PowerPoint®, or in the image format of your choice at the resolution you need.

What you see is what you get

Avoid copying and pasting plots, images, or statistics into other software programs for editing and collating. Devote the time previously spent on these tasks to your science because what you see in FCS Express is what you get when exporting your analysis.

Microsoft Office-like Text Boxes

Organize and present publication-ready results for your daily analysis

It is useful, and often necessary, to collate and organize results from your analysis in one place. FCS Express simplifies the process by harnessing the power of a complete word processor, right inside the program. Adding text and information is as simple as adding a text box and typing just like working in any other PowerPoint presentation or Word document. In FCS Express, you can pull annotations, keywords, system information, and any results from your experiment directly into a text box with the added benefit of real-time updating as gates and data files change. Just like PowerPoint and Word, you will have the ability to format tables, text, and fonts to help make even your daily analysis ready for publication at a click.

Built-in Text Editor

Emphasize your results by formatting your fonts, adding bullet points, changing line spacing, and other text editing functions with which you know from using Office. The best part is your fully-formatted text boxes and results will update as gates and data files change.

Time-saving Export

Export important information within text boxes by simply dragging and dropping to your batch process. Information will be exported to Excel, LIS/LIMS systems, and any other output you define. Text boxes will also be included in your PowerPoint or PDF exports and can even be copied and pasted when needed. Save time and be more accurate by using text boxes with annotations to avoid manual data entry and possible transcription errors.

Results Where You Need Them

Text boxes may be inserted anywhere in your analysis, including directly within plots. Placing text boxes in convenient locations allows you to summarize experiments rapidly.

Spend hours creating reports?

Create multiple documents of your analysis for many files with a single click!

Communication is the key to science and today's researchers need to be able to export results quickly and easily, often times to many different formats. Batch processing in FCS Express makes reporting and sharing your results quick and easy with a variety of export modes and file types. Create images, PDFs, PPTs, XLSs, and more for all your samples by hitting run. Export directly to your LIS/LIMS at same the time, too.

Generate results faster than ever

One click will send your analysis to PDF, PowerPoint, Excel, LIS/LIMS, and more. You can customize the information included in the reports, where documents are saved, allowing you to always be ready to share your results in moments.

Speed through samples in seconds

Batch process enables analysis of many samples using the same gating strategy. Set up your analysis strategy with necessary samples and let FCS Express iterate through all your files rapidly.

Only export when necessary

FCS Express IVD, you can specify when a report is created with batch processing by defining criteria based on any statistical or data-specific information. Documents meeting the condition are exported without you manually selecting which files for every run.

Recall gate positions with snapshots

FCS Express automatically records gating, quadrant, and marker position changes between every sample during the batch process. With the batch processing features in FCS Express you will no longer need to make tedious manual adjustments of gates to match those of your exports when rerunning or reviewing an analysis.

Panels

Panels let you quickly and automatically load a set of data files into the correct plots in an analysis. A layout with an active panel can be saved and used over and over again to analyze multiple sets of data for the ultimate efficiency.

What you see is what you get

Avoid copying and pasting plots, images, or statistics into other software programs to create a report. Devote the time previously spent on these tasks to your science because what you see in FCS Express is what you get when exporting your analysis during a batch analysis.

Real Time Charting

FCS Express offers integrated graphing tools that link directly to your flow cytometry gates

If you find yourself copy and pasting out to Excel and other graphing software with your current analysis tools, only to do it again and again when a gate change is requested, then your not alone. FCS Express eliminates the middle man by utilizing Excel-like spreadsheets built directly into the software that link up with your gates and statistics so you can skip the copy and paste and get results in real time.

Pie Charts

Pie Charts facilitate the visualization of relationships between statistics and how they combine to form a conceptual whole.  Rather than export your flow cytometry data to a spreadsheet or other graphing program, simply insert a Pie Chart in FCS Express and watch as it updates automatically with your gates, markers, quads, and .fcs file data.

Bar Charts

Bar Charts update immediately as your analysis changes including standard deviation bars. Bar Charts are fully formattable within FCS Express, eliminating the need to use additional software programs to achieve your results.

Scatter Plots

FCS Express has built-in Scatter Plots that update in real time when gates are adjusted. Data from Scatter Plots can be overlaid from the same or multiple flow cytometry experiments. Scatter Plots are fully formattable, including dot, error bar, and all other plot properties.

Scatter with Regression Plots

FCS Express can display your flow cytometry data as a Scatter with Regression Plot when performing a time-course study, dose-response curve, or other quantitative experiment. Choose from many available equations to fit your data and watch the curve update in a batch process or as you adjust your gates!

Regression Analysis

FCS Express enables the calculation of regression fits directly from your gates and statistics. You can overlay a regression with the click of a button. Most importantly, your regression formulas, line fits, and analysis can all be linked directly to your flow cytometry data allowing you to view changes to your regression analysis in real time as gates and data are adjusted.

Levey-Jennings Plots

With Levey-Jennings plots, you may visualize quality control data to ensure test metrics are stable over time and fall within a predetermined range. The range, more commonly referred to as the control limits, allows the test metric to be assessed based on whether the values fall within the range or outside of the range. Values falling outside of the control limits are considered "out of control" and when occurring on consecutive measurements can indicate the accuracy of the test metric has shifted.

Other Summary Plots

Box and Whisker, Violin, and Beeswarm Plots are new additions to enable you to see the central tendency and distribution of your data.

Easily Access, Edit, and Use Keywords

FCS Express provides easy access to the information stored within your .FCS files.

A flow cytometry FCS file contains a section known as the header which contains information about the data, including the names of the parameters, the amplification method, acquisition date and time and many other information. With other software packages accessing this information can be tricky and using it annotate your analysis can be even harder. FCS Express allows you to view, change, and use any of the information contained in the header and to save the changed information in with the file.

Add or Modify Keywords with Ease

It is easy to add additional keywords in FCS Express. Simply use the Add Keyword option or create an excel table with your new keywords and apply it to your flow cytometry experiment. FCS Express has options for adding or changing annotations and keywords for one, some, or all of your files in an experiment.

Change Annotations at Any Time

If you entered the wrong name for the operator, parameter, stain, or other meta-data at the time of acquisition you can simply change it. After editing simply save the file with a new name and continue on with analysis.

Anonymize Your Data

At times it is necessary to strip any identifying information from your flow cytometry data files. With FCS Express you can remove keywords one by one or use the convenient anonymizing tool to remove identifying information from one or many files with a click.

Sort Data By Keywords

Columns for sorting data by specific keywords and meta-data are accessible to you at any time. Want to quickly arrange your flow cytometry data files for analysis by the time they were acquired or the tube number? Simply use the sorting features in FCS Express to organize your analysis.

Tokens Get You Results

Tokens are live updating text, statistics, and system information from your analysis

Making sure your analysis is annotated correctly and organizing your statistics is crucial for all scientists. FCS Express allows you to insert live-updating text called Tokens anywhere in your analysis. They can display plot statistics, file keywords, gate and layout properties, and even system information from your computer. Tokens will accelerate your time to results.

Keep Track of Your Experiments

Tokens allow you to access the date and time that your files were acquired and other information that you entered at the time of acquisition. With tokens you will never need to enter information manually, or copy and paste, if you have entered it when you acquired your files. Never sift through your lab note book for important dates and experiment information again.

Incorporate Stats Directly in Your Plots

Tokens can be dynamically incorporated into plots to quickly summarize your analysis in place or to create stunning figures for publication and collaboration.

Tokens are as Easy as a Drag and Drop

Easily add tokens anywhere by dragging and dropping. Have a plot with a gate on it? Drag and Drop the gate to insert a token for MFI. Have a data file open? Drag and Drop to access keywords and show the Tube Number. Need statistics from your stats tables somewhere else? Drag and Drop to place the statistics anywhere in the layout.

Customize and Create

Custom Tokens can help you create a custom value for any mathematical expression, allow you to perform conditional IF/THEN statements, convert numeric values into simple text such as Positive or Negative all while remaining live updating so as you move a gate, your custom values update immediately.

Tokens in the Clinical Setting

FCS Express IVD incorporates special tokens that are critical for Clinical labs. These tokens can be triggered by any numeric or text values and allow for real time Statistical Classifiers, Font Formatting, Page Visibility, and Batch Process Action triggering.

Publication Quality Graphics

Eliminate the need to use multiple software packages to present your data

Generating high quality graphics and reports to communicate your results can be hard with other software packages and may involve using many different image editing tools. When you are ready to publish and present your data FCS Express has you covered by supporting direct high-resolution exports to PowerPoint, PDF, and six image formats at up to 750 DPI resolution. Never fight with low resolution graphics and bulky workarounds again when all you want are results!

Skip the Copy and Paste

In FCS Express your analysis is your presentation, figure, or final report. Simply click to export directly to PDF, PowerPoint, or in the image format of your choice at the resolution you desire.

Full Reports at High Resolution

Your analysis can be set up as a full report including high resolution graphics. Your reports are linked up directly to your data so as you move a gate your report updates immediately. When you are ready to publish, simply export to the format of your choice.

High Quality PowerPoint Presentations

]If you have ever struggled with low quality PowerPoint exports from your current software then FCS Express is for you. Your analysis and plots are exported from FCS Express at the highest resolution possible and individual plots and objects will arrive in PowerPoint also as individual objects so you can move, resize, and format all objects independently in PPT if needed.

Big Experiments? Big Data? No Problem

You never have to sacrifice the quality of your reports and figures due to the size of your experiments or number of data files with FCS Express. The easy to use batch processing feature in FCS Express allows you to export at the same quality across any number of samples, to multiple formats (PowerPoint, Word, Excel, PDF, Images) simultaneously, all with the click of a button.
Learn Why You Should Use FCS Express Too!

Visualize Your Data Easily and Automatically

FCS Express Supports Seven Data Scaling Methods and Autoscaling for Flow Cytometry Data Analysis

There are a wide variety of ways that flow and image cytometry data is displayed in todays challenging environment. Depending on the instrument, and the parameters, data can displayed in different ways (i.e. linear, log, biexponential). You need a tool that can accommodate all the different scaling options required by different instruments on the market.

Automatic Axis Scaling

FCS Express supports all of the commonly used axis scalings for your flow cytometry data files. In most cases your data will appear exactly as it did during acquisition automatically so you can spend less time formatting plots and more time getting results.

Flexible Axis Scaling

When you need to change between different axis scalings simply choose from the FCS Express drop down which scale to apply to your data. All commonly used axis scalings for flow cytometry data analysis are available for use.

Instrument Specific Settings

Not all instruments are created equal with some data from instruments acquired with different maximum ranges. No matter what the dynamic range of your cytometer FCS Express has you covered with options to scale your plots automatically according to the cytometer type so all you have to do is analyze.

Display Data According to Your Needs

Axis scaling is performed on a plot-by-plot basis meaning that you can compare different scalings side by side to make sure you are making the best decisions when identifying populations in flow cytometry data analysis. When you are ready to share your results simply use the plot that best tells the story of your data.

Biexponential for BD FACS Diva

As a result of our close collaboration with BD, data files opened in FCS Express will look exactly as they did in Diva and use the same scaling/bi-exponential transition points.

Mac and PC Compatibility

Seamlessly move between computers and operating systems with your flow cytometry data at any time

In todays environment, users need the flexibility to use different computing tools. Even within a single lab, some researchers will use Mac and others will use PC. Even a single individual may use different computers at different times. Software needs to be able to accommodate these challenges. FCS Express runs the same way, with the same features, on Mac or PC or Both!

Flexibility to Analyze Where You Need To

Flow cytometry data analysis is not always performed in the lab. FCS Express licenses are flexible and portable. Get analysis done when and where you need to. They can be used on any computers you would like, Mac or PC, or both!

Same Features, Different OS

It does not matter if you are performing day to day flow cytometry or running complex high dimensionality reduction algorithms. The same features will be available in the same place in FCS Express regardless of your operating system of choice.

Use on Unlimited Computers

Licenses of FCS Express are not “locked” to a PC or a Mac which means you can download, install, and use FCS Express on as many computers as you would like. With De Novo Software’s convenient Internet Dongle Licenses accessing the software only requires an internet connection.

Move between computers and colleagues

Start a flow cytometry analysis on your PC in the lab and complete it on your Mac at home. Share your analysis completed on your Mac with your colleagues who use PC. With FCS Express you have the ultimate flexibility.

Use the Right Computer for the Job

The computer you use to perform simple flow cytometry analysis may not be the same computer you use for highly complex immunophenotyping, plate based screens or, tSNE/vSNE / SPADE / PCA calculations. Use FCS Express to move seamlessly between Mac and PC, high performance or everyday, and use the right machine for the job.