Flow Cytometry Gating Made Easy

Flexibility and ease of use no matter how complicated your gating strategy may be

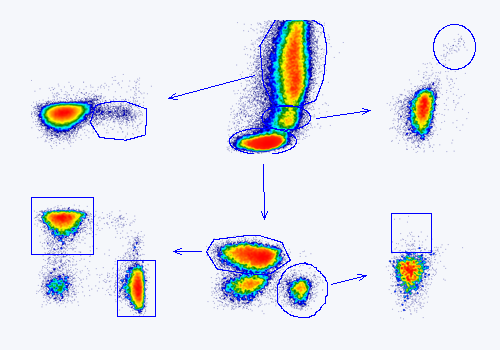
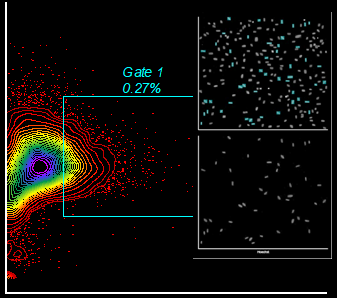
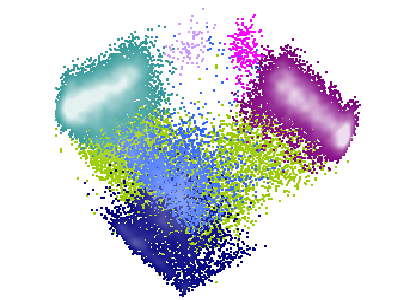
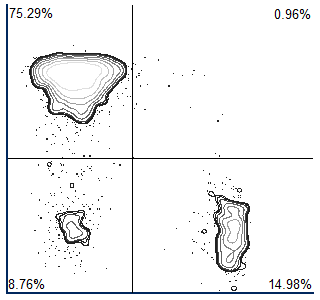
Gates are at the basis of any cytometry analysis as they allow researchers to analyze cell sub populations. The problem can become that managing gates, visualizing sub-populations, back gating, and reporting the results from gated populations is tedious in other software packages. With FCS Express gates are easy to create, manage, visualize and gate based statistics update immediately as your gates are moved on your plots. FCS Express also maintains flexibility to adjust gates sample by sample when needed so you can analyze sub-groups of data, or outlier samples, with ease.
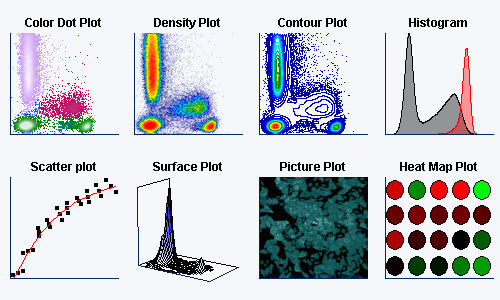
Gating types

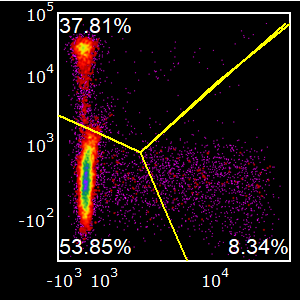
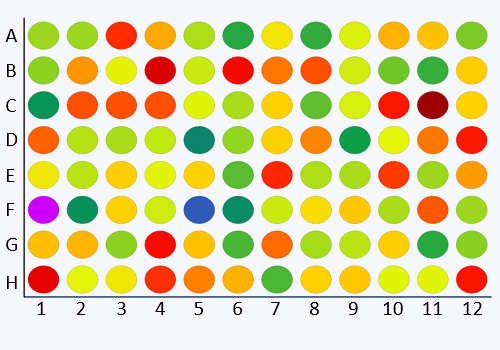
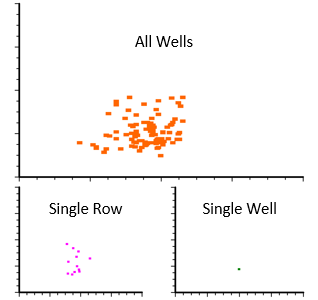
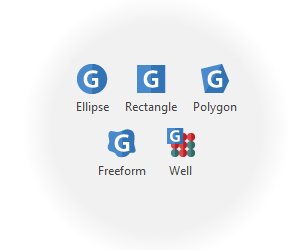
FCS Express supports 6 types of gates for flow cytometry data analysis: Ellipse, Rectangle (on 1 or 2 dimensions), Polygon, Freeform and Well gates to make sure you have the right tool for the job.
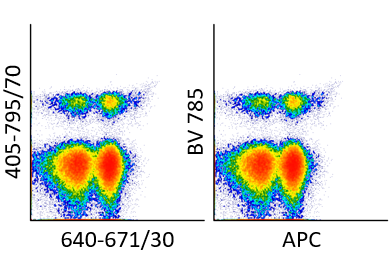
Drag & Drop

Applying gates is as simple as a drag and drop. Moreover, drag & drop can be used to create or open a new plot that is already gated on the population of interest.

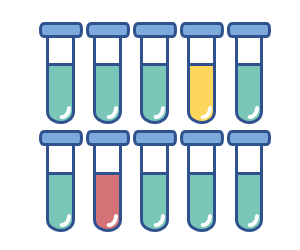
Sample-by-sample refinement

When individual samples require their own gating positions, FCS Express allows you to refine the gate shape and position for individual flow cytometry samples without changing the hierarchy.   Any gate may also be converted to group based gate to easily apply different gating strategies between different groups of samples.
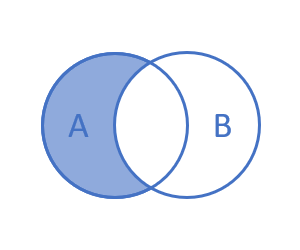
Combination Gates

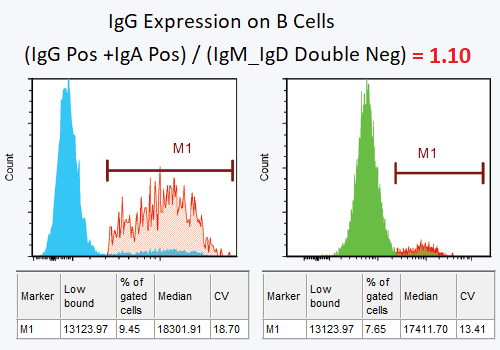
For more sophisticated gating, FCS Express allows you to combine more than one gate into a formula using boolean operators (i.e. AND, OR, XOR and NOT). Combination gate matrices may also be easily accessed to create every possible positive and negative combination for any gates selected.
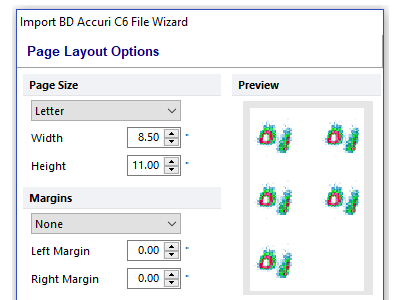
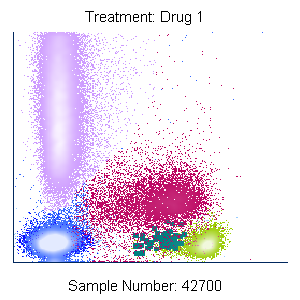
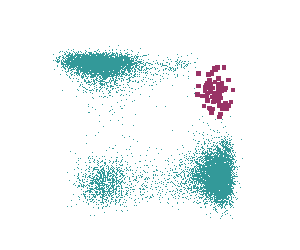
Ready to Publish

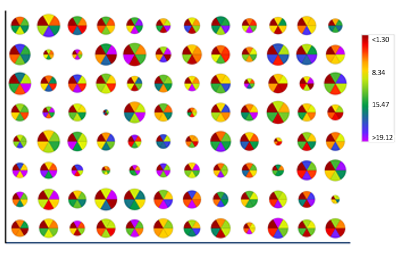
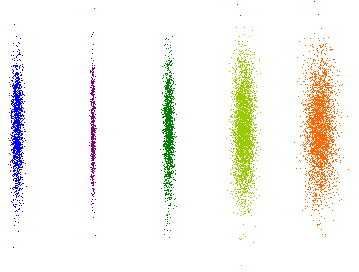
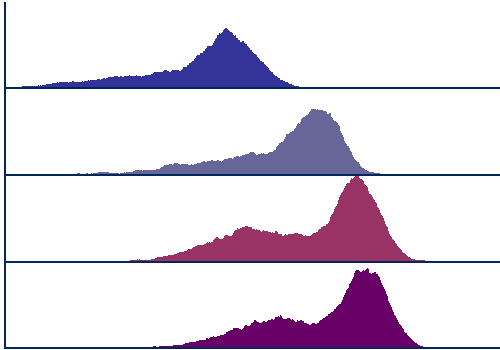
Gates can be customized in multiple ways, including color and border width so your plots are ready to publish when analysis is complete. For rare event analysis, researchers can emphasize populations with larger dots drawing attention to subsets of interest.
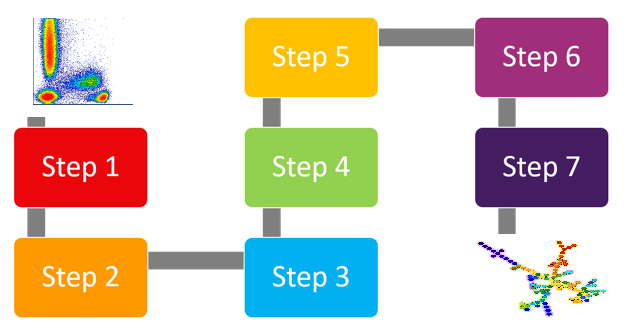
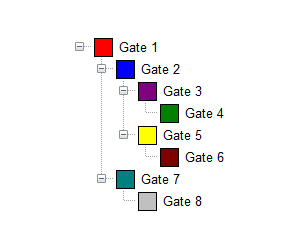
Gating Hierarchy

FCS Express supports hierarchical gating for flow cytometry data analysis to create gates based on subsets of other gates. Gating logic is flexible and may be easily adjusted at any time by Drag & Drop.

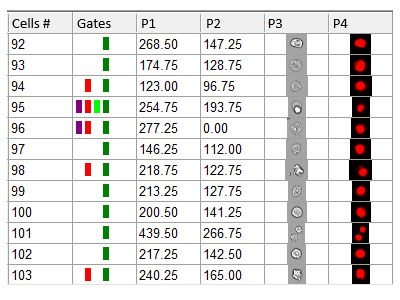
Gating at the Single Cell Level

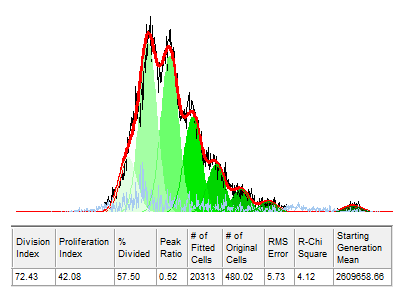
Gates can also be applied to, and created on, raw data at the single cell level which is particularly useful for image cytometry data set . Raw data, either numeric values and single cell pictures, can be displayed, gated, and managed including full back gating capability.

Compatibility with your instrument

FCS Express has the compatibility you need for Flow and Image Cytometry

Today's researchers and core facilities may acquire data from one or many flow cytometers and generate image based data from many sources. The challenge them becomes finding an analysis platform that will handle, analyze, and report data easily and consistently no matter the source. FCS Express is compatible with data files from all flow cytometers on the market and supports many image derived data files. FCS Express also provides specialized import tools and data scaling options to ensure your files are displayed exactly as they were at the time of acquisition allowing you to focus on getting results. The IVD version of FCS Express does not include Image Cytometry analysis functionality. 

Read FCS Files From Any Source

FCS Express is directly compatible with any FCS and LMD data files from all manufacturers and all past versions of the FCS file format. Simply load your FCS files and let FCS Express do the rest!

Import Your Analysis Directly From BD FACSDiVa™ and the Accuri C6™

If you have acquired on the Diva or Accuri platforms there is no need to recreate your entire analysis from scratch. With FCS Express, you can import your BD FACSDiva Experiment files or BD Acccuri C6 and C6 Plus files directly. Once your experiment is loaded into FCS Express, you can treat your plots and gates just like they were created in FCS Express.

Compatible With A Wide Variety of Imaging Systems and Data Formats

FCS Express has Image Cytometry data analysis functionality and is compatible with a growing list of image data file formats. CellProfiler and ImageJ allow you compatibility for free with any images while the Image Cytometry Experiment (ICE) standard format and other proprietary formats from ThermoFisher, PerkinElmer, Molecular Devices, Amnis, Chemometec, and Nexcelom are also supported with more compatibility being added all the time.

Import CSV Files Directly

Any data stored in CSV file format can be opened, plotted, gated, and reported on like a standard flow or image cytometry data file. You can directly load CSV files into the software and use our extensive library of analysis and visualization tools to get more insight from your results.

Index Sorting

FCS Express supports index sorting data files from all major platforms including Influx (BD Biosciences), Summit Software (Beckman Coulter), Diva (BD Biosciences), and Chorus (BD Biosciences). Simply load your .FCS files and start analyzing

Instrument Specific Settings

Not all instruments are created equal with some data from instruments acquired with different maximum ranges. No matter what the dynamic range of your cytometer FCS Express has you covered with options to scale your plots automatically according to the cytometer type so all you have to do is analyze.

Comprehensive Statistics

The right statistics where you need them when you need them

Today's researchers need to have access to statistics and results from data as quickly and easily as possible. While standard statistics like % Gated and MFI are important, researchers generally rely on multiple software packages outside of their flow analysis software to perform simple to complex calculations in spreadsheets and other graphing tools. FCS Express comes packed with all of the standard descriptive statistics you have come to expect with the added ability to use spreadsheets directly within the software. Using statistical analysis tools in FCS Express allows you to see your results update as gates and data files change while skipping the copy and paste out to other packages

Spreadsheets linked to your data

Perform powerful statistical analysis and generate custom formulas with our Integrated Spreadsheets. Spreadsheets can perform most of the operations found in Microsoft Excel. Importantly the values in Spreadsheets are linked directly to your data, so when you move your gates or change data files the Spreadsheet values will update in real-time.

Custom Statistics

Create equations, functions, and statistics that update in real time based on your analysis. Eliminate manual calculations for better efficiency, accuracy, and standardization. With FCS Express, there’s no need to move your complex data analysis to outside programs. You can do it all right within FCS Express.

Results where you need them

FCS Express allows you to integrate your statistics anywhere on your layout. From plots to custom tables and text boxes, you can format and display your results the way you want. Make your layouts and images publication ready with FCS Express!

Regression Analysis and Statistical Tests

Perform statistical testing and regression analysis all within FCS Express. From the T-Test, Chi-Squared, Z-Prime, to Michaelis-Menten and Logistic Regression, see what FCS Express can do for your data analysis.

Specialized Analysis Tools and Statistics

Working with kinetics data? Modeling cell cycle or proliferation results? Need to calculate the concentration of your gated cells? Our specialized analysis tools come with a complete set of statistical reporting and output options. Make complex tasks easy with FCS Express!

FCS Express and Image Cytometry

The power of flow cytometry analysis for your image cytometry data sets

Managing your image analysis results and raw data can be a daunting task. FCS Express is a powerful data analysis and reporting package that allows you to move between your images, single cell images, and phenotypic results with ease. From single images to high content and highly multiplexed tissue sections, FCS Express has you covered with a wide variety of compatible instruments and data formats.

Flow Cytometry Analysis for Images

Research, High content screening, Digital Pathology or Histology... They all benefit from using a flow cytometry data analysis strategy for your imaging data. FCS Express brings everything you would expect in a dedicated flow analysis software directly to your imaging analysis pipeline. From plots to gates to regression analysis and high content screening, see what FCS Express can do for you!

Fully Interactive Data Analysis

Move seamlessly between raw images and the events on your plots. Picture plots allow you to view your data in context while data grids provide a convenient way to display all of the raw parameter and single cell information. Both plot types make it possible to work interactively between your raw image data, populations, single cells and gates on your plots.

Broad compatibility for imaging systems

FCS Express is compatible with a growing list of image data file formats. CellProfiler and ImageJ allow you compatibility for free with any images while the Image Cytometry Experiment (ICE) standard format and other proprietary formats from ThermoFisher, PerkinElmer, Molecular Devices, Amnis, Chemometec, and Nexcelom are also supported with more compatibility being added all the time.

Report results easily and directly

Eliminate the redundant data processing steps you now perform in Excel or create PowerPoint presentations with a click of a button. With FCS Express, you can export your data in a variety of formats and batch process large data sets saving you time while eliminating repetitive tasks.

High Content? No problem.

Whether you are analyzing single images or thousands from plate based screens, FCS Express will allow you to quickly analyze, summarize, and report at the plate, population, or single cell level to quickly get the results you need.

Already performing flow cytometry?

Odds are you also use image cytometry in your research. FCS Express allows you to use the same software to analyze and present your flow and imaging results side by side. FCS Express provides an analysis solution for both your Flow Cytometry and Image Cytometry data in a single package.

Transformations

Perform tSNE, UMAP, SPADE, FlowSOM, PCA, Clustering and More...

Acquiring highly multi-parametric flow cytometry data sets is becoming more routine with the advent of new instrumentation and reagents but challenges remain to distill the information into visualizations that can be easily assessed and reported. Data transformation algorithms in the form of tSNE, UMAP, FlowSOM, SPADE, kMeans, Principal Component Analysis (PCA), and others have been developed to help meet those needs. FCS Express allows researchers to easily access and use these tools without relying on complicated scripting or plugins by integrating in an intuitive interface with drag and drop functionality.

Dimensionality Reduction

FCS Express integrates both t-SNE and UMAP via an easy to use interface where you simply select the parameters from your flow cytometry data to include and choose the variables for the algorithm to run. Drag and drop the transformation to any plot to calculate and view the results. Transformed result may be displayed in any plot type in FCS Express and further be colored with density or heat mapping to get you the results you need with publication ready quality.

SPADE

SPADE trees are easily created and displayed in heat maps where each cluster is depicted as a node of the branched tree. Heat maps may be formatted to color each node based on the expression of a given marker or based on any statistic associated with the cluster. Moreover, the size of each node can be displayed proportional to a given statistic allowing you more flexibility to get the results you need from your flow cytometry data, all at publication ready quality.

FlowSOM

FlowSOM is a clustering and visualization tool that facilitates the analysis of high-dimensional data. Clusters are arranged via a Self-Organizing Map (SOM), in which events within a given cluster are most similar to each other, followed by those within an adjacent cluster.  A second clustering step (i.e., meta-clustering) is subsequently performed, in which the clusters themselves are grouped according to similarity, and provides a basis for discerning biological similarity. In FCS Express, FlowSOM is visualized with Heat maps.

K-Means Clustering

K-Means clustering allows you to quickly perform cluster analysis and review your clustered results in histograms, 2D plots, and heat maps. Clusters may easily be gated, back gated, and further integrated into your analysis and report with the simple drag and drop.

Pipelines

Pipelines enable researchers to use the flexible and intuitive interface of FCS Express to perform advanced data processing and analysis step-by-step, without the need for external applications such as R or Python. No more writing complex programming scripts and having to rely on plugins. With FCS Express you have access to many of the most common and cutting-edge data analysis tools directly within the software.

Parameter Math

If you have ever needed to create a ratio of parameters or perform another custom calculation at the event by event level then Parameter Math is for you. Parameter Math allows you to perform any mathematical function on your data parameters including sequences of formulas and may be set up to automatically perform calculations on your data as it is loaded into FCS Express so you can get results faster than ever.

Principal Component Analysis

Principal Components Analysis may allow you to find and analyze new populations of interest based on transformations of existing parameters or even allow you to use less parameters to analyze the same data set. Principal components defined and applied to a plot in FCS Express are accessible for analysis as new parameters on plots.

R Integration

If you prefer to use your own algorithms or scripts others have developed FCS Express seamlessly integrates your flow cytometry data with R to load your scripts, apply the transformation to your data sets, and get results with a simple drag and drop to a plot.

Compensation - Simplified

No matter when you perform flow cytometry compensation, FCS Express has you covered

Today's instruments are capable of collecting more parameters than ever before making compensation increasingly complex, yet necessary. Having an easy to use and robust tool for loading, viewing, comparing, and creating new compensation matrices is essential. FCS Express allows you to view compensations from acquisition, define your own from controls, and modify the matrix directly on your analysis computer all while updating in real time on your plots

Compensate According to Your Needs

Flow cytometry compensation from the time of acquisition may be automatically loaded with your data or choose your own default to use. FCS Express also allows you to perform new compensation automatically through an easy to use wizard while slider bars are available to make manual adjustments based on your controls.

Auto Compensation Made Easy

The Automatic Compensation Setup takes you through the compensation process in a few easy steps. Simply load your controls, define positive and negative populations, and calculate the matrix.

Easy to Use Interface

Our Easy to Use Compensation Navigator helps you to organize and make sense of your compensations. You can view, edit, and update your flow cytometry compensations with just one click!

Compare Compensations Easily

FCS Express allows you read in any compensation from any fcs file or create your own. There are no limits to the number of compensations you can define in your analysis while multiple compensations can be viewed side by side in any plot. View compensations from different days, compare acquisition vs post-acquisition compensations, compare compensated vs uncompensated, all in the same layout and side by side.

Update Your Compensation in Real-Time

Make updates to your compensations in FCS Express and see the results in real-time. As adjustments are made to the compensation setup, and/or directly to the matrix, your flow cytometry analysis will update immediately to help you visualize changes based on your controls without waiting.

Spillover Spreading (SSM) and Cross Staining Index (CSI) matrices

Spillover Spreading Matrix (SSM) and Cross Staining Index (CSI) matrices are both automatically calculated at the end of the Compensation/Unmixing wizard.

Powerful Cell Cycle Modeling

Integrated flow cytometry cell cycle analysis with Multicycle

Often when trying to analyze flow cytometry DNA histograms for cell cycle or DNA analysis, the use of simple region markers on the histogram is not adequate. Especially if the DNA histogram exhibits a lot of debris from poor sample preparation and/or there are multiple DNA populations with different DNA content in the same histogram. When these conditions arise, it is necessary to use a powerful mathematical model to remove the debris component and deconvolute the multiple peaks in the histogram. The MultiCycle AV DNA analysis tool is built into FCS Express to address those issues and is provided free with every license.

DNA Analysis with Multicycle AV

In partnership with Phoenix Flow Systems, we have combined the comprehensive DNA analysis capabilities of Multicycle AV with FCS Express. You can now obtain the best of both worlds: flexible flow cytometry data analysis and reporting with FCS Express and powerful cell cycle modeling tools with Multicycle AV.

Cell Cycle Modeling to Suit Your Needs

Included free with FCS Express is Multicycle AV. It provides advanced modeling that will fit a variety of cell cycles with background, debris, and/or aggregation correction.

Optimize Your DNA Analysis

Multicycle AV automatically detects the number of cycling populations and applies 6 different models to help you determine the best fit for your flow cytometry data. With multiple levels of automation, such as manual and autofit modes, Multicycle AV gives you complete control over your cell cycle modeling parameters.

Comprehensive Cell Cycle Statistics

Multicycle provides a full spectrum of cell cycle statistical output that may be incorporated into your flow cytometry reports, including simple and clear summary, interpretation, and confidence statements.

Plots with Flexible Formatting

FCS Express has the visualizations you need to move from flow cytometry analysis to publication

Communicating your results visually is an important aspect of any analysis, report, or publication. With other cytometry analysis packages researchers tend to rely heavily on external software tools to prepare their plots and figures for presentation and publication. With FCS Express every aspect of your plots can be easily customized directly in the software so you arrive at the visualization needed during analysis. Whether you are looking for a colorful backgated plot or histogram overlay or plots that use greyscale to avoid color page charges, FCS Express has you covered.

Customize Any Plot

All plots can be fully customized in FCS Express allowing you to change backgrounds, dot colors, dot sizes, color schemes, titles, fonts, and more. Customize your plots for day to day flow cytometry analysis so you are ready present or publish at anytime or pick and choose a few representative plots to customize when needed.

Custom Parameter Labels

Often the default parameter label that is saved with your flow cytometry data file is not descriptive enough. FCS Express allows you to use the default labels that exist in the data file or create custom parameter label sets that appear on your plots. Importantly, parameter label sets do not change your original data.

Be a scientist, not a graphic designer

If you ever find yourself using multiple graphic editing packages to get your analysis ready for publication you know how much time and effort can be involved. With FCS Express what you see is what you get. Your figures are ready instantly and better yet, when a simple gate change is needed your formatted plots will update immediately so you don't have to start the process over again.

Specialized Analysis Plots

When your flow cytometry experiment calls for a specialized analysis technique you can depend on FCS Express for having the right plot for the job. With dedicated plots and analysis tools for cell cycle, proliferation, kinetics analysis, spectral data, and more you will always have what you need at a click.

Avoid Color Page Charges

Not every plot needs to be in full color to convey your results while using black and white or greyscale can save you big money when publishing. FCS Express allows you to work with any plots in greyscale or black and white to get you the visualization you need without breaking the bank when you publish.

Index Sorting

Use FCS Express to access your flow cytometry index sort data directly from an FCS file

Index sorting allows researchers to review the complete phenotype of every single event sorted into a plate and associate that event with all sorted and non sorted events. Some software packages require you to load .CSV files and run complicated scripts to view the sort data in the context of the plate. FCS Express makes index sorting data analysis simply by utilizing Heat Maps along with the standard plot offerings while loading data as a standard FCS file. No scripting, no csv files, no worries - just results!

Compatibility

FCS Express supports flow cytometry index sorting data files from all major platforms including Influx (BD Biosciences), Summit Software (Beckman Coulter), Diva (BD Biosciences), and Chorus (BD Biosciences). Simply load your .FCS files and start analyzing

Visualizing Data

Heat Maps allow you to quickly view your entire flow cytometry sort plate in a single click. Overlays allow a user to view up to six statistics and/or parameters on a single heat map so visualizing multi-marker sorts becomes easy. Users may also add a radius statistic, which changes the size of the well to reflect the selected statistic.

Make the connection from plate to cell

Heat maps will display the number of events and parameter based phenotypic data for all sorted events but wells may be gated on individually, or as groups, allowing users to back gate events onto other plots and quickly find individually sorted cells among the entire phenotype range.

Skip the script

With other flow cytometry software packages you need to use complicated scripts or csv files to access your data. With FCS Express, skip the script and load your data directly into heat maps from your FCS files.

Publication-ready Histograms

See your flow cytometry data clearly with Histograms

Histograms are an integral aspect of flow and image cytometry data analysis, but researchers often spend too much time and resources in other software packages trying to visualize results and prepare figures for publication. With FCS Express, every aspect of your histograms maybe controlled to arrive at the perfect plot for day-to-day analysis or your next publication in Nature.

Marker-to-marker Linking

Markers easily are linked to each other by dragging and dropping end points together. Markers can be linked between different histograms or even to gates on 2D plots allowing you the ultimate flexibility for your flow cytometry data analysis.

Overlays made easy

Create histogram overlays with a simple drag and drop. Multiple samples may be overlaid on your histogram to assess different files for the same parameter or compare multiple parameters for one sample. There are no limits on the number of overlays, allowing you to get your flow cytometry results fast.

Change the perspective

Make your flow cytometry data stand out with three dimensional overlays or use our unique stacked overlay mode to get a clearer picture of your results.

Histogram subtraction

When positives and control populations are close together, the process of dividing positives from negatives can become less of a science and more of an art. FCS Express helps you put the science back again, using the Overton subtraction technique and others to tease apart populations.